Copyright
©The Author(s) 2017.
World J Clin Oncol. Jun 10, 2017; 8(3): 214-229
Published online Jun 10, 2017. doi: 10.5306/wjco.v8.i3.214
Published online Jun 10, 2017. doi: 10.5306/wjco.v8.i3.214
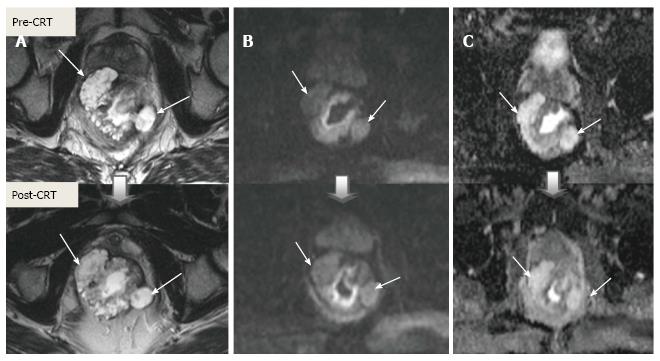
Figure 21 Mucinous adenocarcinoma.
A: T2; B: Diffusion-weighted; C: ADC images in the same patient, baseline and post-CRT images are shown on upper and lower series, respectively. The mucinous tumor exhibits hyperintensity on T2, diffusion, and ADC images before and after treatment regardless of their response to treatment. Pre-and post-treatment ADC values are 1.70 × 10⁻³ mm²/s and 2.10 × 10⁻³ mm²/s, respectively. Their response to CRT cannot be assessed using diffusion-weighted imaging. CRT: Chemoradiotherapy.
- Citation: Engin G, Sharifov R. Magnetic resonance imaging for diagnosis and neoadjuvant treatment evaluation in locally advanced rectal cancer: A pictorial review. World J Clin Oncol 2017; 8(3): 214-229
- URL: https://www.wjgnet.com/2218-4333/full/v8/i3/214.htm
- DOI: https://dx.doi.org/10.5306/wjco.v8.i3.214


