Copyright
©The Author(s) 2017.
World J Clin Oncol. Jun 10, 2017; 8(3): 214-229
Published online Jun 10, 2017. doi: 10.5306/wjco.v8.i3.214
Published online Jun 10, 2017. doi: 10.5306/wjco.v8.i3.214
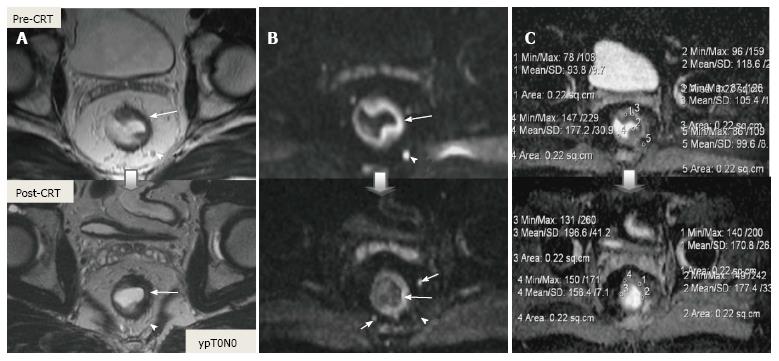
Figure 20 Post-chemoradiotherapy restaging using diffusion-weighted imaging in ypT0 rectal tumor.
On T2-weighted (A), DW (B) and ADC (C) images in the same patient, baseline and post-CRT images are shown on upper and lower series, respectively. A: Posttreatment T2-weighted axial image shows a thick wall of low-signal-intensity fibrosis and areas suspicious for residual tumor have intermediate signal-intensity in the previous rectal tumor area (long arrow); B: Posttreatment DW images delinate a small foci of intermediate and low signal-intensity, respectively, compatible with residual tumor (long arrow); C: ADC images show post-therapy mean ADC increase (1.05 × 10⁻³ mm²/s vs 1.80 × 10⁻³ mm²/s), compatible with therapy response, but not with complete response. The suspicious mesorectal lymph node (arrowheads) is invisible on T2 and DWI after CRT, but the other two are still visible (short arrows). This case is an example for false-positive tumor and lymph node response evaluation of DWI. DWI: Diffusion-weighted imaging; CRT: Chemoradiotherapy.
- Citation: Engin G, Sharifov R. Magnetic resonance imaging for diagnosis and neoadjuvant treatment evaluation in locally advanced rectal cancer: A pictorial review. World J Clin Oncol 2017; 8(3): 214-229
- URL: https://www.wjgnet.com/2218-4333/full/v8/i3/214.htm
- DOI: https://dx.doi.org/10.5306/wjco.v8.i3.214


