Copyright
©The Author(s) 2017.
World J Clin Oncol. Jun 10, 2017; 8(3): 214-229
Published online Jun 10, 2017. doi: 10.5306/wjco.v8.i3.214
Published online Jun 10, 2017. doi: 10.5306/wjco.v8.i3.214
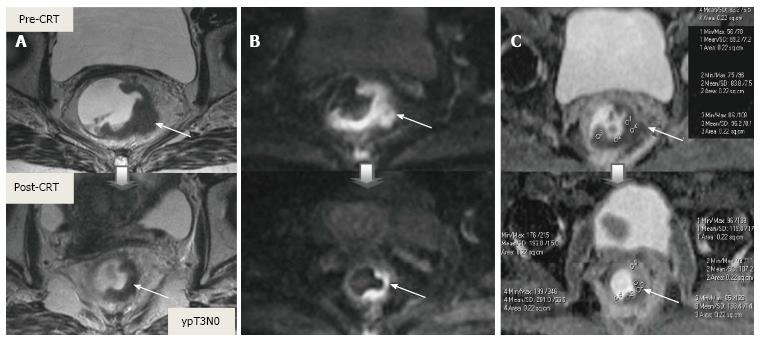
Figure 18 Post-chemoradiotherapy restaging using diffusion-weighted imaging in ypT3 rectal tumor.
On T2-weighted (A), DW (B) and ADC (C) images in the same patient, baseline and post-CRT images are shown on upper and lower series, respectively. A: Posttreatment T2-weighted axial image shows semiannular infiltrating tumor, compatible with a residual T3 tumor (arrow); B: Posttreatment DW; C: ADC images delineate high and low signal-intensity corresponding to the tumor, respectively (arrow). Pre- and post-treatment mean ADC values are 0.68-0.72, 1.22-1.44 × 10⁻³ mm²/s, respectively, in the tumor area. Post-therapy ADC increase is compatible with therapy response. CRT: Chemoradiotherapy.
- Citation: Engin G, Sharifov R. Magnetic resonance imaging for diagnosis and neoadjuvant treatment evaluation in locally advanced rectal cancer: A pictorial review. World J Clin Oncol 2017; 8(3): 214-229
- URL: https://www.wjgnet.com/2218-4333/full/v8/i3/214.htm
- DOI: https://dx.doi.org/10.5306/wjco.v8.i3.214


