Copyright
©The Author(s) 2017.
World J Clin Oncol. Jun 10, 2017; 8(3): 214-229
Published online Jun 10, 2017. doi: 10.5306/wjco.v8.i3.214
Published online Jun 10, 2017. doi: 10.5306/wjco.v8.i3.214
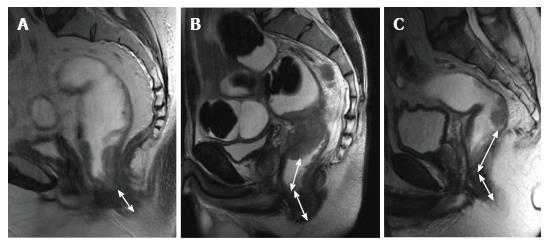
Figure 7 Rectal tumor levels.
T2-weighted sagittal images in different patients with rectal carcinoma show distance from the anal verge (double-headed arrows) in (A) low rectal, (B) midrectal, and (C) upper rectal tumors (low rectal tumor, < 5 cm; midrectal, 5-10 cm; upper rectal, > 10 cm).
- Citation: Engin G, Sharifov R. Magnetic resonance imaging for diagnosis and neoadjuvant treatment evaluation in locally advanced rectal cancer: A pictorial review. World J Clin Oncol 2017; 8(3): 214-229
- URL: https://www.wjgnet.com/2218-4333/full/v8/i3/214.htm
- DOI: https://dx.doi.org/10.5306/wjco.v8.i3.214


