Copyright
©The Author(s) 2016.
World J Clin Oncol. Oct 10, 2016; 7(5): 395-405
Published online Oct 10, 2016. doi: 10.5306/wjco.v7.i5.395
Published online Oct 10, 2016. doi: 10.5306/wjco.v7.i5.395
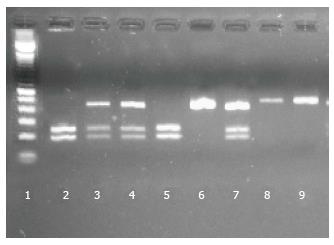
Figure 2 Gel electrophoresis showing PCR-RFLP product of CYP1A1 gene digested with MspI restriction enzyme.
CYP1A1 gene T3801C variant gives the following digestion band patterns: TT, 420 bp; TC, 420 bp and 237 bp + 183 bp; and CC, 237 bp + 183 bp. Numbered lanes represents: 1: 100 bp molecular weight marker; 2, 5: CC homozygous type; 3, 4, 7: TC heterozygous type; 6, 8, 9: TT homozygous type.
- Citation: Cerliani MB, Pavicic W, Gili JA, Klein G, Saba S, Richard S. Cigarette smoking, dietary habits and genetic polymorphisms in GSTT1, GSTM1 and CYP1A1 metabolic genes: A case-control study in oncohematological diseases. World J Clin Oncol 2016; 7(5): 395-405
- URL: https://www.wjgnet.com/2218-4333/full/v7/i5/395.htm
- DOI: https://dx.doi.org/10.5306/wjco.v7.i5.395


