Copyright
©The Author(s) 2016.
World J Clin Oncol. Jun 10, 2016; 7(3): 293-301
Published online Jun 10, 2016. doi: 10.5306/wjco.v7.i3.293
Published online Jun 10, 2016. doi: 10.5306/wjco.v7.i3.293
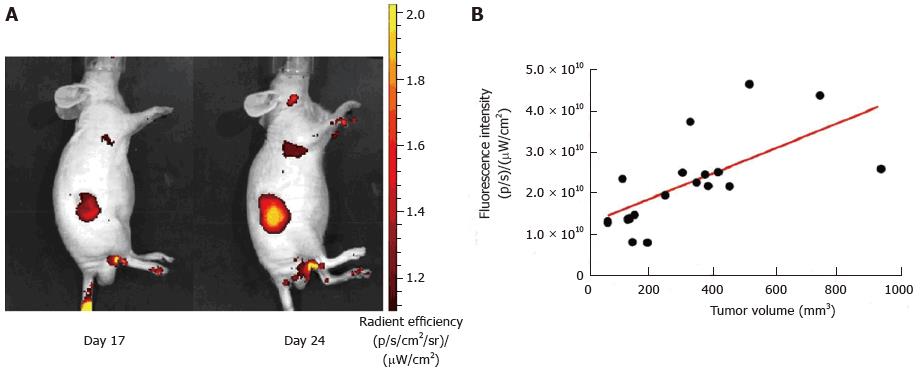
Figure 1 Correlation of tumor volume (HCT116 cells xenograft) and 2-DG-750 fluorescence signal uptake.
A: Representative animal images showing the increase in fluorescence signal intensity with tumor development (day 17 and day 24 post-xenograft); B: Correlation between tumor development determined using a caliper and increase in fluorescence signal intensity (Pearson’s correlation factor r = 0.4197; P = 0.0036).
- Citation: Veziant J, Gagnière J, Jouberton E, Bonnin V, Sauvanet P, Pezet D, Barnich N, Miot-Noirault E, Bonnet M. Association of colorectal cancer with pathogenic Escherichia coli: Focus on mechanisms using optical imaging. World J Clin Oncol 2016; 7(3): 293-301
- URL: https://www.wjgnet.com/2218-4333/full/v7/i3/293.htm
- DOI: https://dx.doi.org/10.5306/wjco.v7.i3.293


