Copyright
©The Author(s) 2016.
World J Clin Oncol. Apr 10, 2016; 7(2): 265-269
Published online Apr 10, 2016. doi: 10.5306/wjco.v7.i2.265
Published online Apr 10, 2016. doi: 10.5306/wjco.v7.i2.265
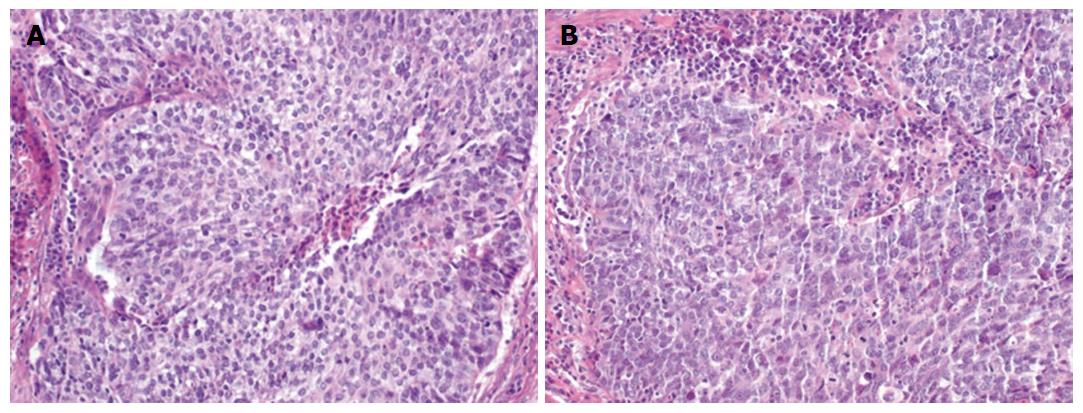
Figure 3 Gallbladder H and E stain.
High power (40 ×) view of the nested tumor shows a relatively monotonous cell population with medium-sized nuclei and a moderate amount of cytoplasm. Central coagulative necrosis is evident on (A) while (B) has frequent mitotic figures.
- Citation: Yogarajah M, Sivasambu B, Shiferaw-Deribe Z. Gallbladder adenocarcinoma and paraneoplastic parathyroid hormone mediated hypercalcemia. World J Clin Oncol 2016; 7(2): 265-269
- URL: https://www.wjgnet.com/2218-4333/full/v7/i2/265.htm
- DOI: https://dx.doi.org/10.5306/wjco.v7.i2.265


