Copyright
©The Author(s) 2015.
World J Clin Oncol. Dec 10, 2015; 6(6): 299-311
Published online Dec 10, 2015. doi: 10.5306/wjco.v6.i6.299
Published online Dec 10, 2015. doi: 10.5306/wjco.v6.i6.299
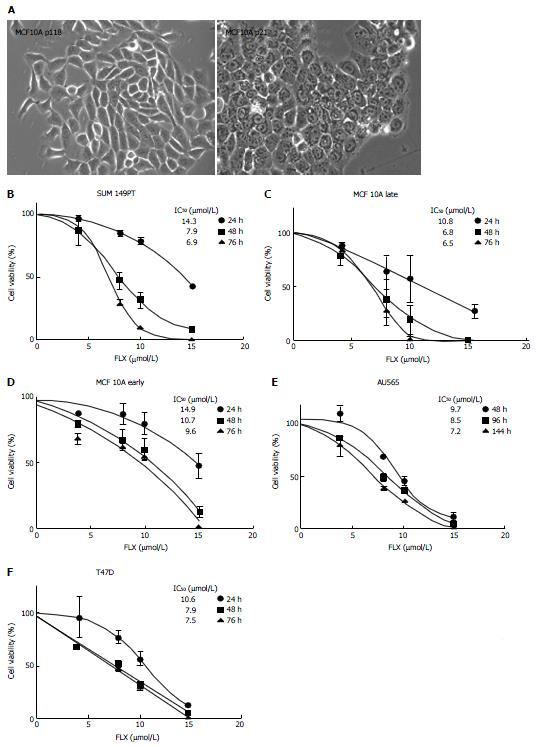
Figure 2 Time-dependent and concentration-dependent inhibition of cell growth induced by fluoxetine.
A: Bright field images of late and early passage of MCF10A cells were shown in 20 × magnification; B-F: The IC50 values for the dose-response curves for each cell line were also indicated; cell viability for each cell line was measured spectrophotometrically by means of MTT assay. Data represented the average of optical densities normalized to untreated samples ± SEM of 6 measurements for each concentration. MTT: 3-(4,5-dimethylthiazol-2-yl)-2,5-diphenyltetrazolium bromide; FLX: Fluoxetine.
- Citation: Bowie M, Pilie P, Wulfkuhle J, Lem S, Hoffman A, Desai S, Petricoin E, Carter A, Ambrose A, Seewaldt V, Yu D, Ibarra Drendall C. Fluoxetine induces cytotoxic endoplasmic reticulum stress and autophagy in triple negative breast cancer. World J Clin Oncol 2015; 6(6): 299-311
- URL: https://www.wjgnet.com/2218-4333/full/v6/i6/299.htm
- DOI: https://dx.doi.org/10.5306/wjco.v6.i6.299


