Copyright
©2014 Baishideng Publishing Group Inc.
World J Clin Oncol. Oct 10, 2014; 5(4): 568-575
Published online Oct 10, 2014. doi: 10.5306/wjco.v5.i4.568
Published online Oct 10, 2014. doi: 10.5306/wjco.v5.i4.568
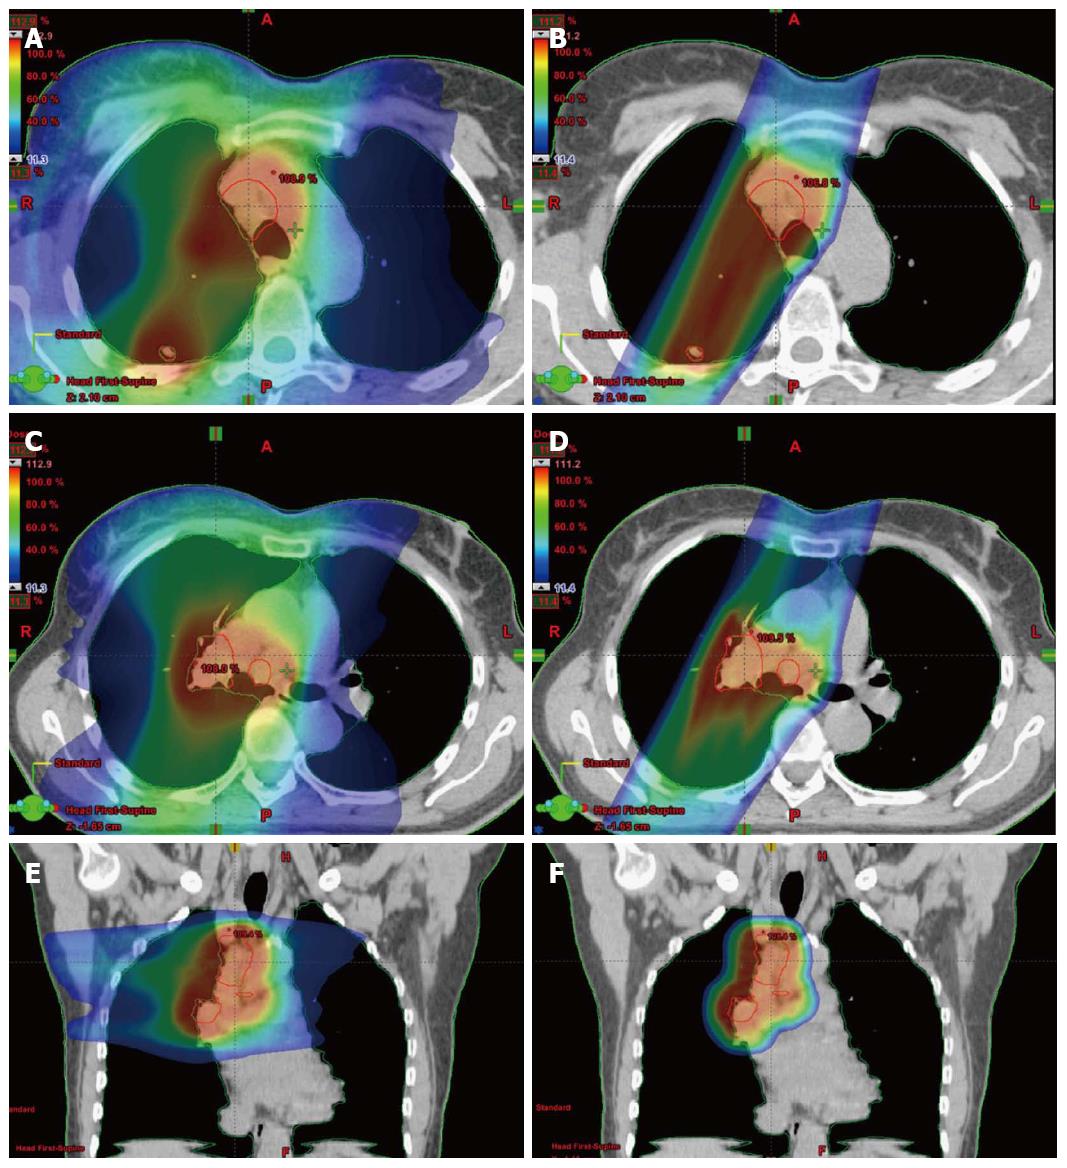
Figure 2 Dosimetric comparisons between photon [left (A, C, E) and proton right (B, D, F)] plans for a stage III lung cancer patient.
Radiation doses shown as color washes warmer colors (red) represent higher doses compared to cooler colors (blue). The first pair of axial slices (A and B) are at a level superior to axial cuts C and D; It is apparent that more normal lung is irradiated on the left than the right; E and F are coronal cuts with dosimetry.
- Citation: Schild SE, Rule WG, Ashman JB, Vora SA, Keole S, Anand A, Liu W, Bues M. Proton beam therapy for locally advanced lung cancer: A review. World J Clin Oncol 2014; 5(4): 568-575
- URL: https://www.wjgnet.com/2218-4333/full/v5/i4/568.htm
- DOI: https://dx.doi.org/10.5306/wjco.v5.i4.568


