Copyright
©2014 Baishideng Publishing Group Inc.
World J Clin Oncol. Aug 10, 2014; 5(3): 425-439
Published online Aug 10, 2014. doi: 10.5306/wjco.v5.i3.425
Published online Aug 10, 2014. doi: 10.5306/wjco.v5.i3.425
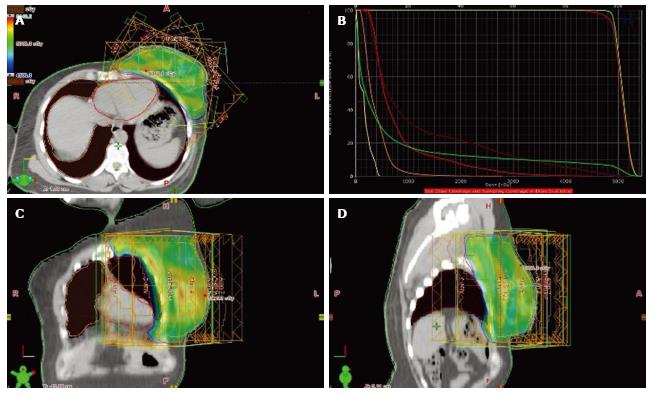
Figure 2 Treatment fields and dose distribution of inverse-planned intensity modulated radiotherapy: Axial section (A), dose-volume histogram (B), coronal section (C) and sagittal section (D).
- Citation: Ozyigit G, Gultekin M. Current role of modern radiotherapy techniques in the management of breast cancer. World J Clin Oncol 2014; 5(3): 425-439
- URL: https://www.wjgnet.com/2218-4333/full/v5/i3/425.htm
- DOI: https://dx.doi.org/10.5306/wjco.v5.i3.425


