Copyright
©2011 Baishideng Publishing Group Co.
World J Clin Oncol. Jul 10, 2011; 2(7): 289-298
Published online Jul 10, 2011. doi: 10.5306/wjco.v2.i7.289
Published online Jul 10, 2011. doi: 10.5306/wjco.v2.i7.289
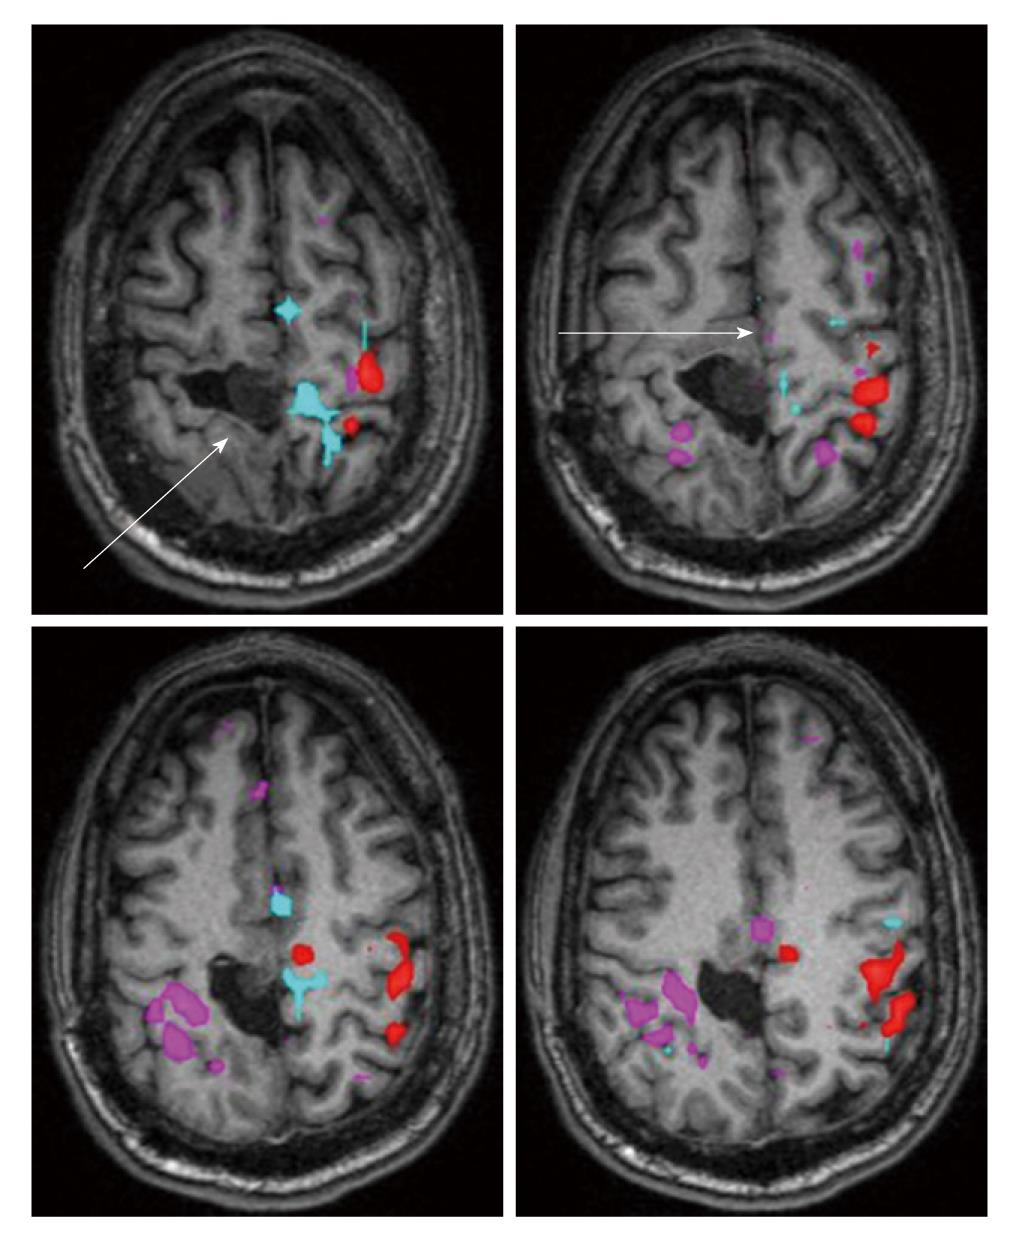
Figure 5 Color coding of Blood Oxygen Level Dependent activation map, overlaid on noncontrast T1-weighted 3D MPRAGE axial images, is as follows: magenta refers to left hand motor task activation (hand opening/closing), thresholded at a T value of 4.
6, while red refers to the right hand motor task, thresholded at a T value of 4.5, and cyan/light blue refers to bilateral foot motor task (toe flexion/extension), thresholded at a clustered cross-correlation value of 0.50. Note the striking absence of any activation on the foot motor task in the foot representation area of the right (ipsilesional) primary motor cortex as well as absence of activation in the superior frontal gyrus (supplementary motor area), while the contralateral homologous regions demonstrate expected activation, as seen color-coded in cyan.
- Citation: Zaca D, Hua J, Pillai JJ. Cerebrovascular reactivity mapping for brain tumor presurgical planning. World J Clin Oncol 2011; 2(7): 289-298
- URL: https://www.wjgnet.com/2218-4333/full/v2/i7/289.htm
- DOI: https://dx.doi.org/10.5306/wjco.v2.i7.289


