Copyright
©2011 Baishideng Publishing Group Co.
World J Clin Oncol. May 10, 2011; 2(5): 217-224
Published online May 10, 2011. doi: 10.5306/wjco.v2.i5.217
Published online May 10, 2011. doi: 10.5306/wjco.v2.i5.217
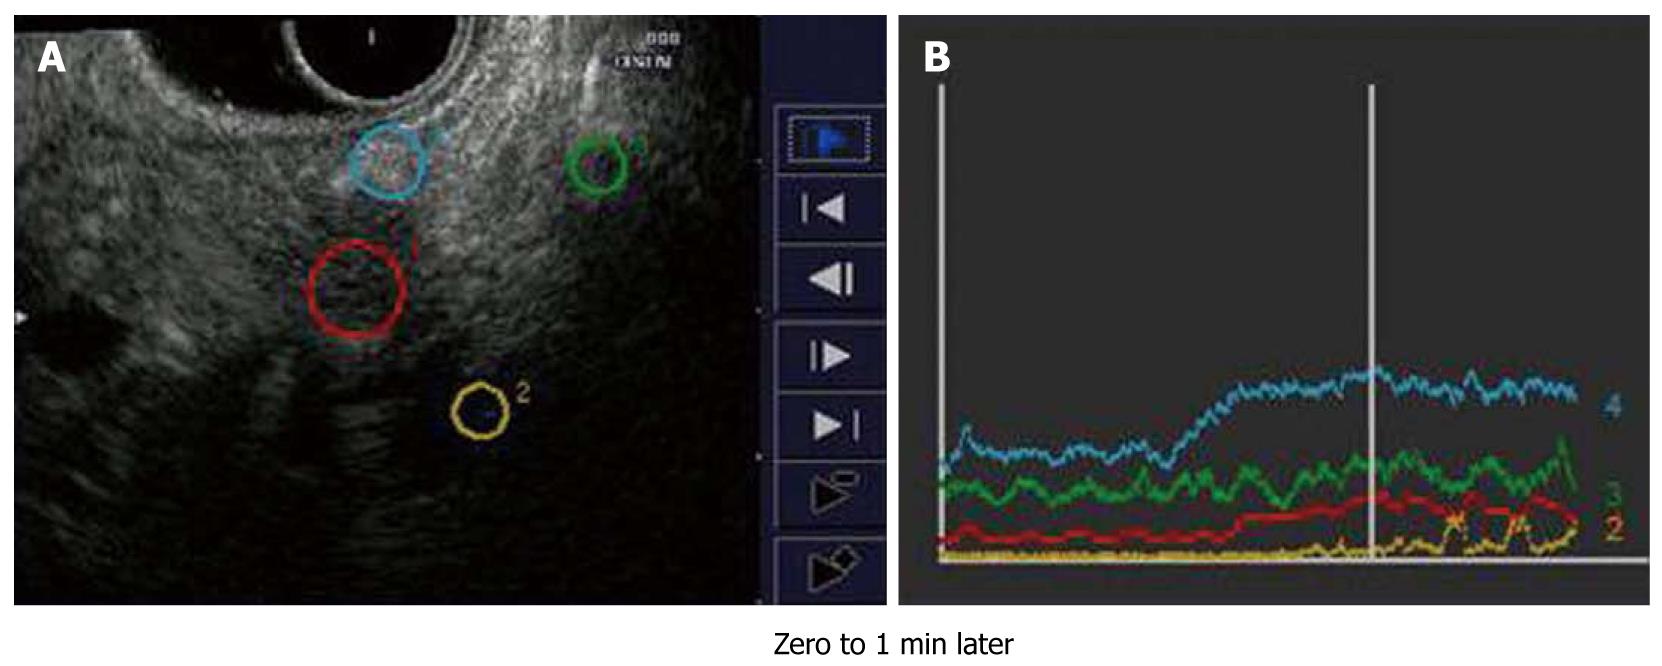
Figure 7 Time intensity curve for pancreatic ductal adenocarcinoma.
A, B: Both settings (settings 1 and 2) can provide a quantitative analysis graphic curve of the changing echo-intensity named the “time intensity curve”.
- Citation: Hirooka Y, Itoh A, Kawashima H, Ohno E, Ishikawa T, Itoh Y, Nakamura Y, Hiramatsu T, Nakamura M, Miyahara R, Ohmiya N, Ishigami M, Katano Y, Goto H. Clinical oncology for pancreatic and biliary cancers: Advances and current limitations. World J Clin Oncol 2011; 2(5): 217-224
- URL: https://www.wjgnet.com/2218-4333/full/v2/i5/217.htm
- DOI: https://dx.doi.org/10.5306/wjco.v2.i5.217


