Copyright
©2011 Baishideng Publishing Group Co.
World J Clin Oncol. Dec 10, 2011; 2(12): 397-403
Published online Dec 10, 2011. doi: 10.5306/wjco.v2.i12.397
Published online Dec 10, 2011. doi: 10.5306/wjco.v2.i12.397
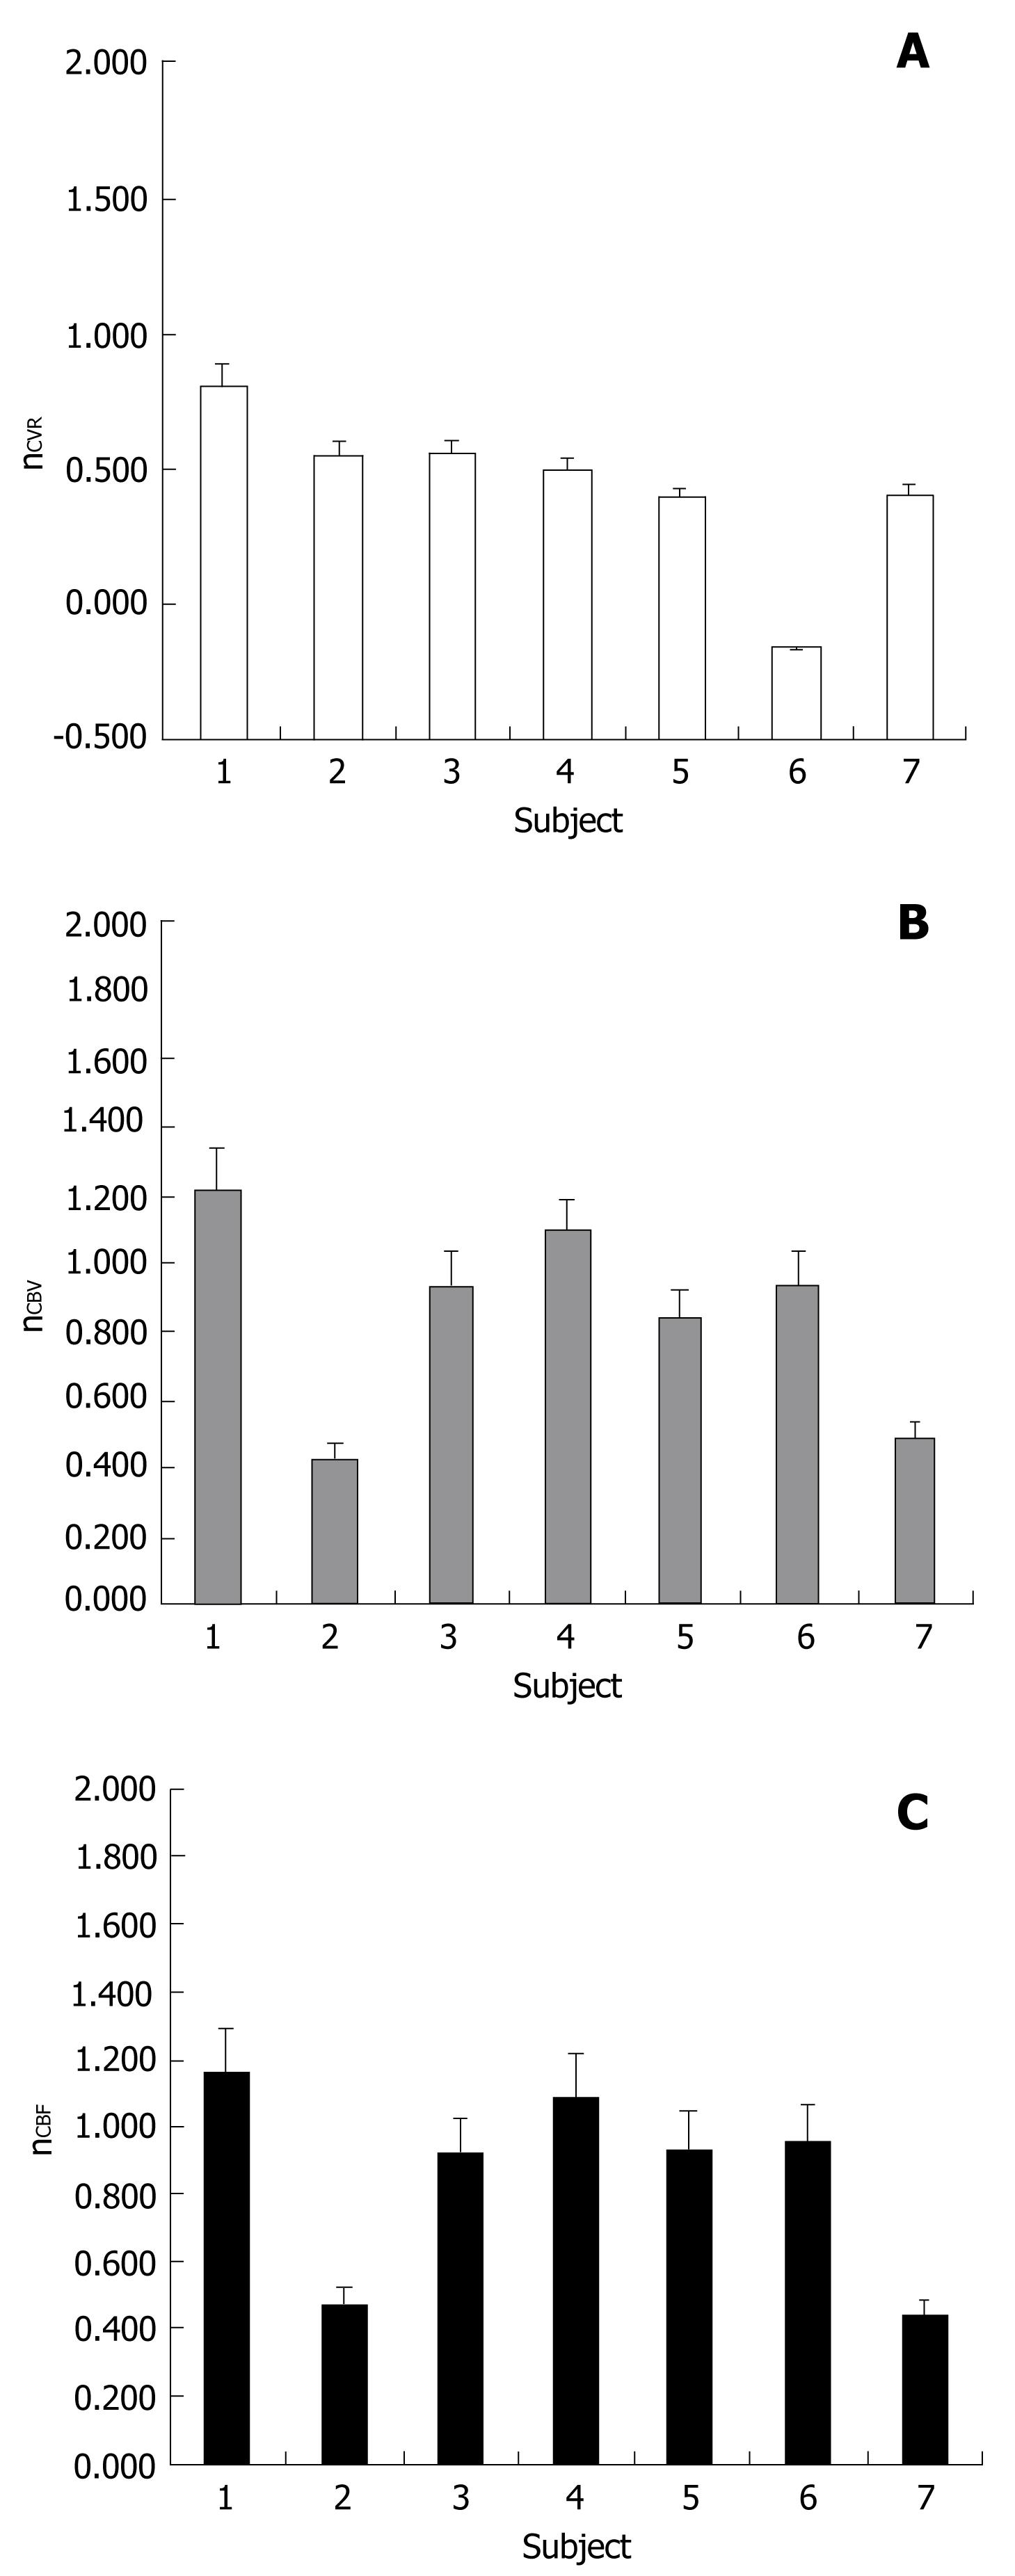
Figure 3 Cerebrovascular reactivity ratio (nCVR) (A) cerebral blood volume ratio (nCBV) (B) and cerebral blood flow ratio (nCBF) (C) distribution for the group of seven patients with classified grade I and grade II tumors included in this study.
In all cases nCVR is less than 1.0 and the median value is significantly less than 1.0 according to the one sample Wilcoxon test. nCBV and nCBF median values are not significantly lower or higher than 1.0.
- Citation: Pillai JJ, Zacá D. Clinical utility of cerebrovascular reactivity mapping in patients with low grade gliomas. World J Clin Oncol 2011; 2(12): 397-403
- URL: https://www.wjgnet.com/2218-4333/full/v2/i12/397.htm
- DOI: https://dx.doi.org/10.5306/wjco.v2.i12.397


