Copyright
©The Author(s) 2024.
World J Clin Oncol. Jul 24, 2024; 15(7): 936-944
Published online Jul 24, 2024. doi: 10.5306/wjco.v15.i7.936
Published online Jul 24, 2024. doi: 10.5306/wjco.v15.i7.936
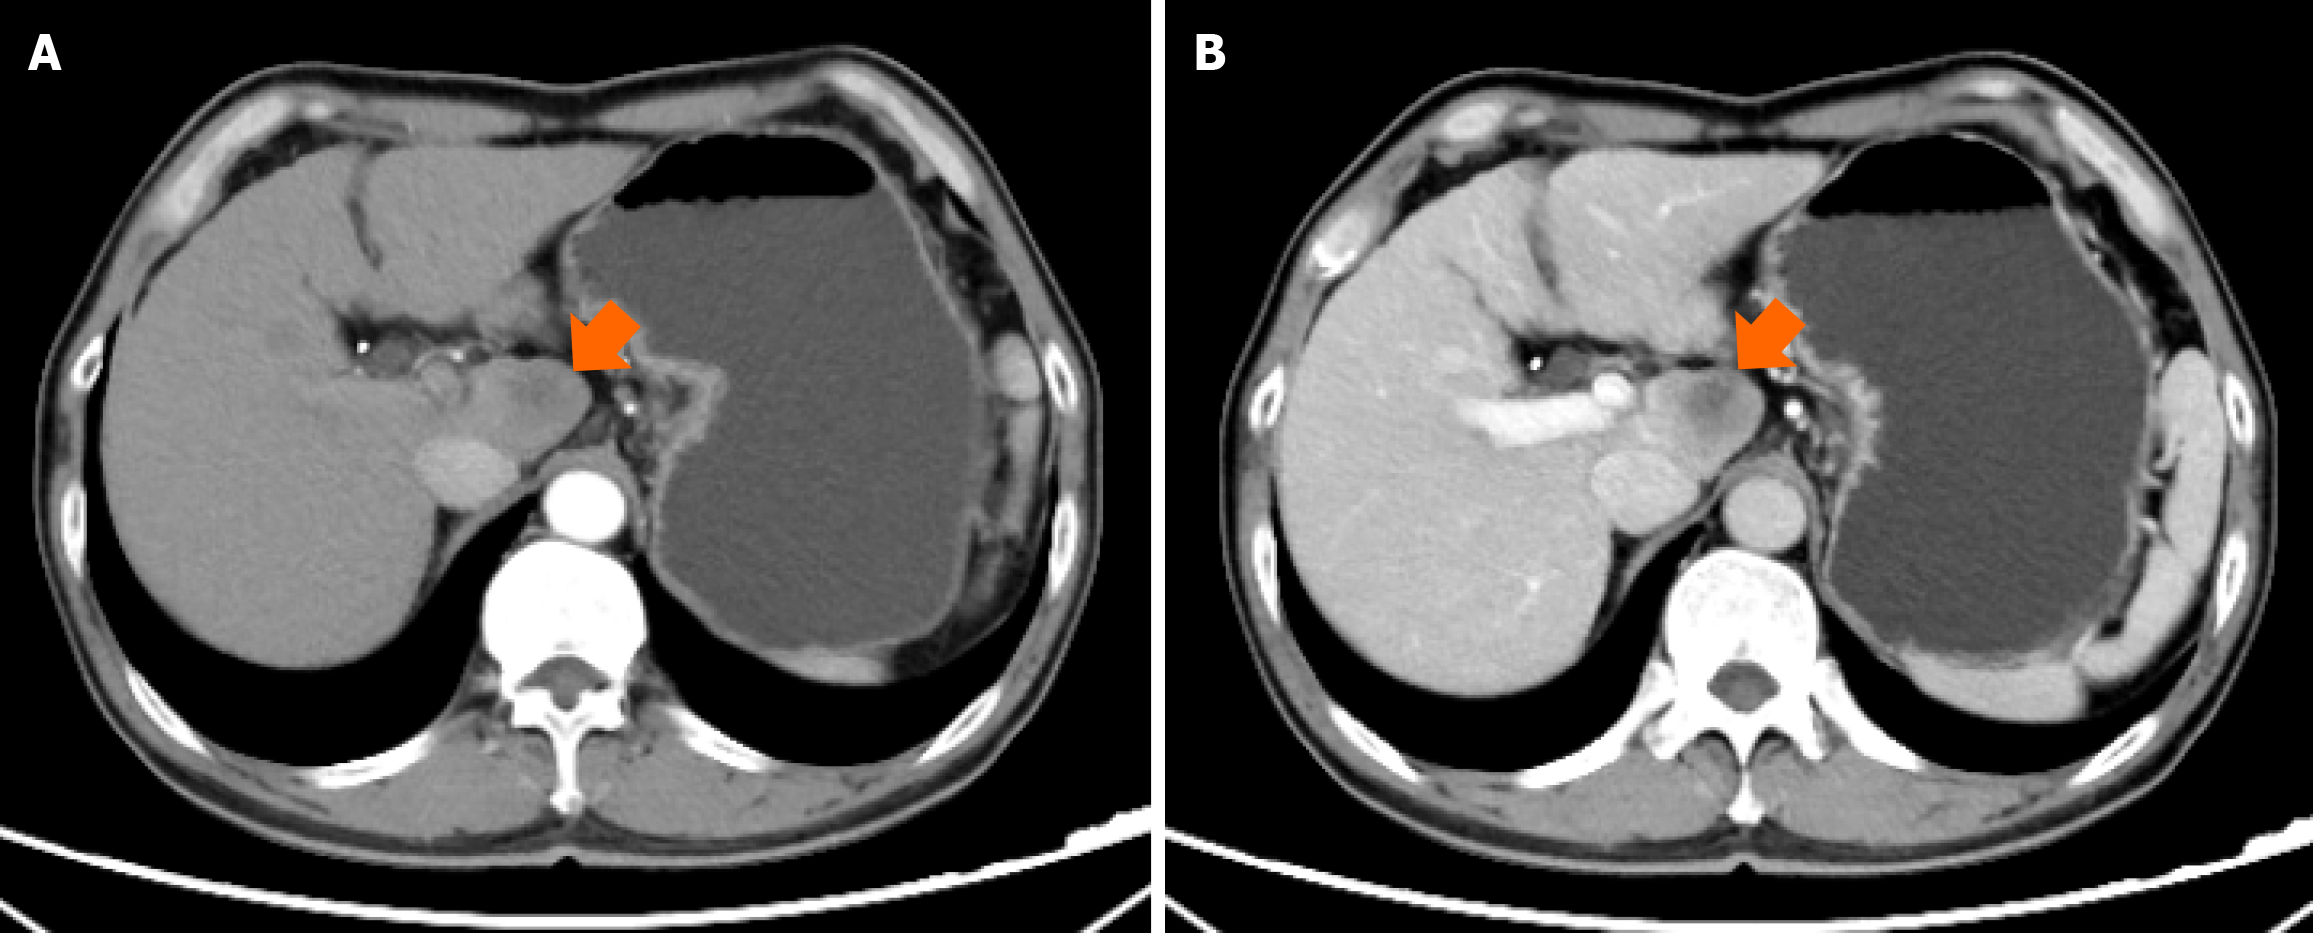
Figure 1 Computed tomography imaging of liver lesion.
A: The arterial phase of computed tomography (CT) showed no obvious enhancement (orange arrow); B: The venous phase of CT showed slightly heterogeneous enhancement (orange arrow).
- Citation: Ma QJ, Wang FH, Yang NN, Wei HL, Liu F. Rare primary squamous cell carcinoma of the intrahepatic bile duct: A case report and review of literature. World J Clin Oncol 2024; 15(7): 936-944
- URL: https://www.wjgnet.com/2218-4333/full/v15/i7/936.htm
- DOI: https://dx.doi.org/10.5306/wjco.v15.i7.936


