Copyright
©The Author(s) 2024.
World J Clin Oncol. Jul 24, 2024; 15(7): 895-907
Published online Jul 24, 2024. doi: 10.5306/wjco.v15.i7.895
Published online Jul 24, 2024. doi: 10.5306/wjco.v15.i7.895
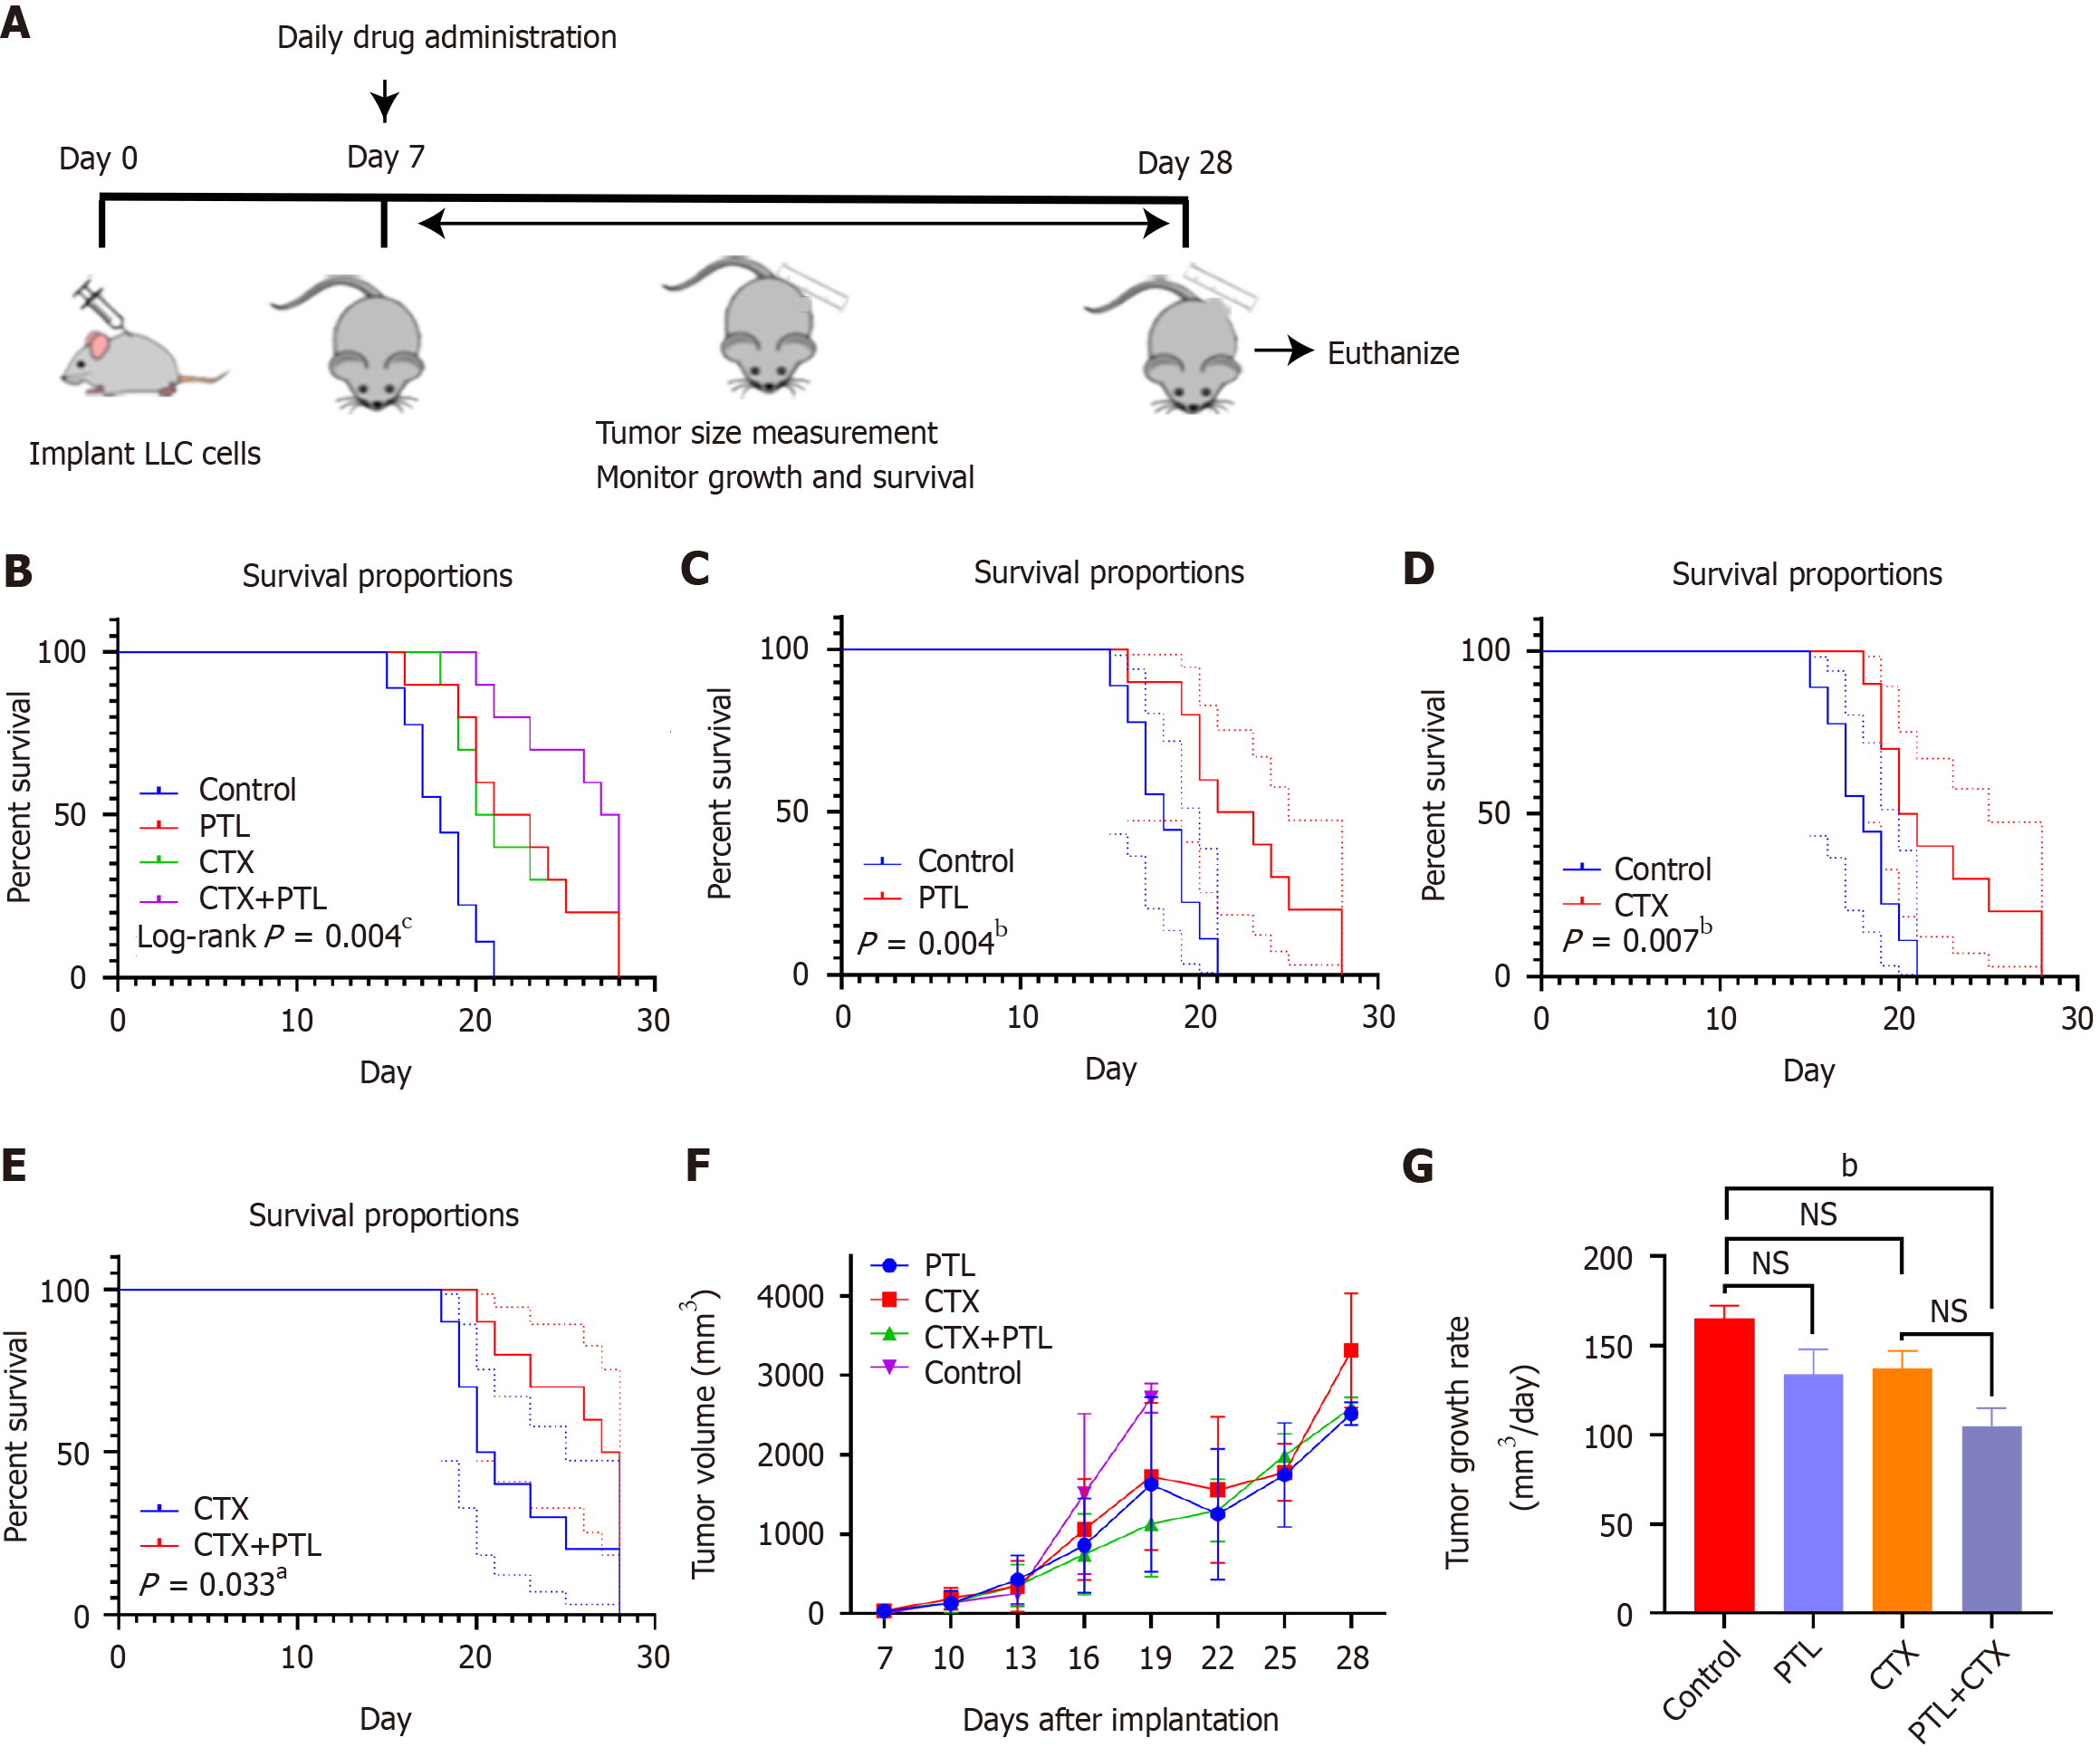
Figure 3 Survival analysis of tumor-bearing mice.
A: Animal experiment process; B: Survival curve and log-rank analysis of 4 groups of tumor-bearing mice; C: Survival comparison between control and parthenolide (PTL) groups; D: Survival comparison between control and cyclophosphamide (CTX) chemotherapy groups; E: Comparison between CTX and PTL + CTX combined groups; F: Tumor growth curve of different groups; G: Comparison of tumor growth rate. n = 10, aP < 0.05, bP < 0.01, cP < 0.001. NS: Not significant; PTL: Parthenolide; CTX: Cyclophosphamide.
- Citation: Cai Z, Gao L, Hu K, Wang QM. Parthenolide enhances the metronomic chemotherapy effect of cyclophosphamide in lung cancer by inhibiting the NF-kB signaling pathway. World J Clin Oncol 2024; 15(7): 895-907
- URL: https://www.wjgnet.com/2218-4333/full/v15/i7/895.htm
- DOI: https://dx.doi.org/10.5306/wjco.v15.i7.895


