Copyright
©The Author(s) 2024.
World J Clin Oncol. Jul 24, 2024; 15(7): 867-894
Published online Jul 24, 2024. doi: 10.5306/wjco.v15.i7.867
Published online Jul 24, 2024. doi: 10.5306/wjco.v15.i7.867
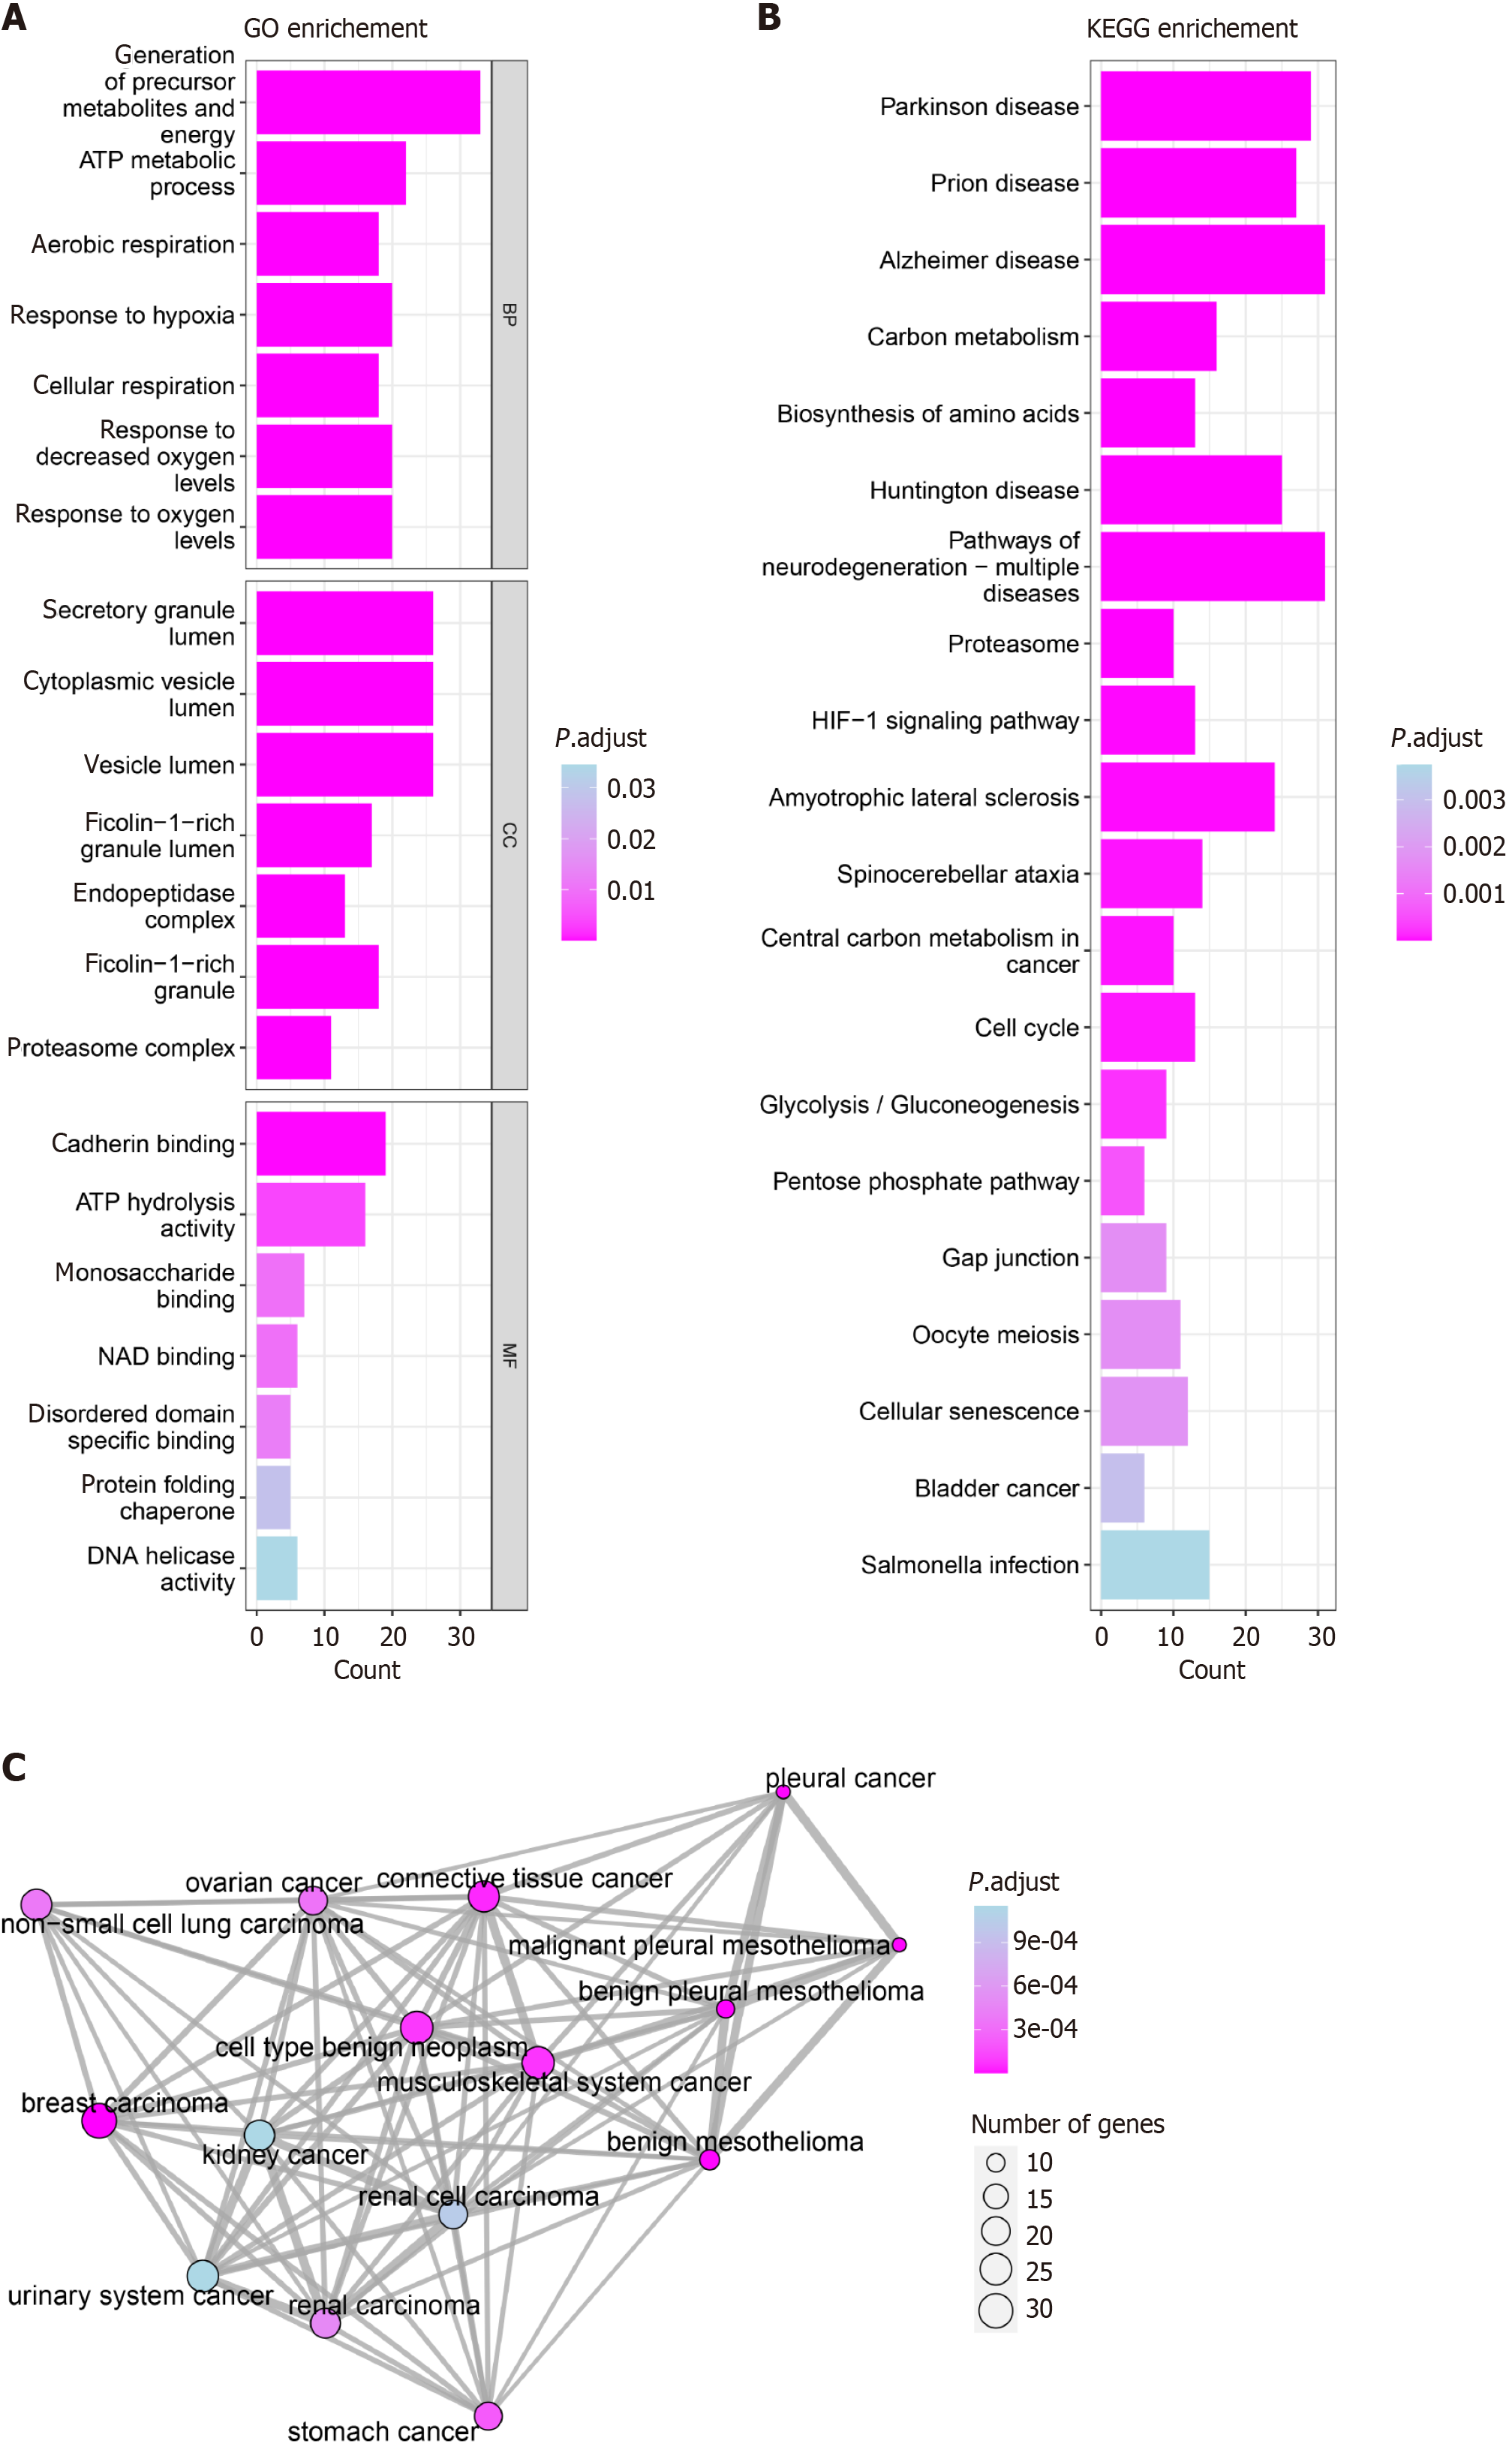
Figure 18 Pathway and disease enrichment analysis annotation.
A: Gene Ontology enrichment; B: Kyoto Encyclopedia of Genes and Genomes enrichment. Columnar length represents the number of gene enrichments; the longer the column, the more gene enrichment. Color indicates the size of the P value; the darker the color, the smaller the P value; C: Disease Ontology enrichment. The area of each circle represents the number of genes; the larger the circle, the more genes are involved. The color of each circle represents the P value; the darker the color, the smaller the P value. GO: Gene Ontology enrichment; KEGG: Kyoto Encyclopedia of Genes and Genomes.
- Citation: Chen JY, Li JD, He RQ, Huang ZG, Chen G, Zou W. Bibliometric analysis of phosphoglycerate kinase 1 expression in breast cancer and its distinct upregulation in triple-negative breast cancer. World J Clin Oncol 2024; 15(7): 867-894
- URL: https://www.wjgnet.com/2218-4333/full/v15/i7/867.htm
- DOI: https://dx.doi.org/10.5306/wjco.v15.i7.867


