Copyright
©The Author(s) 2024.
World J Clin Oncol. Jul 24, 2024; 15(7): 867-894
Published online Jul 24, 2024. doi: 10.5306/wjco.v15.i7.867
Published online Jul 24, 2024. doi: 10.5306/wjco.v15.i7.867
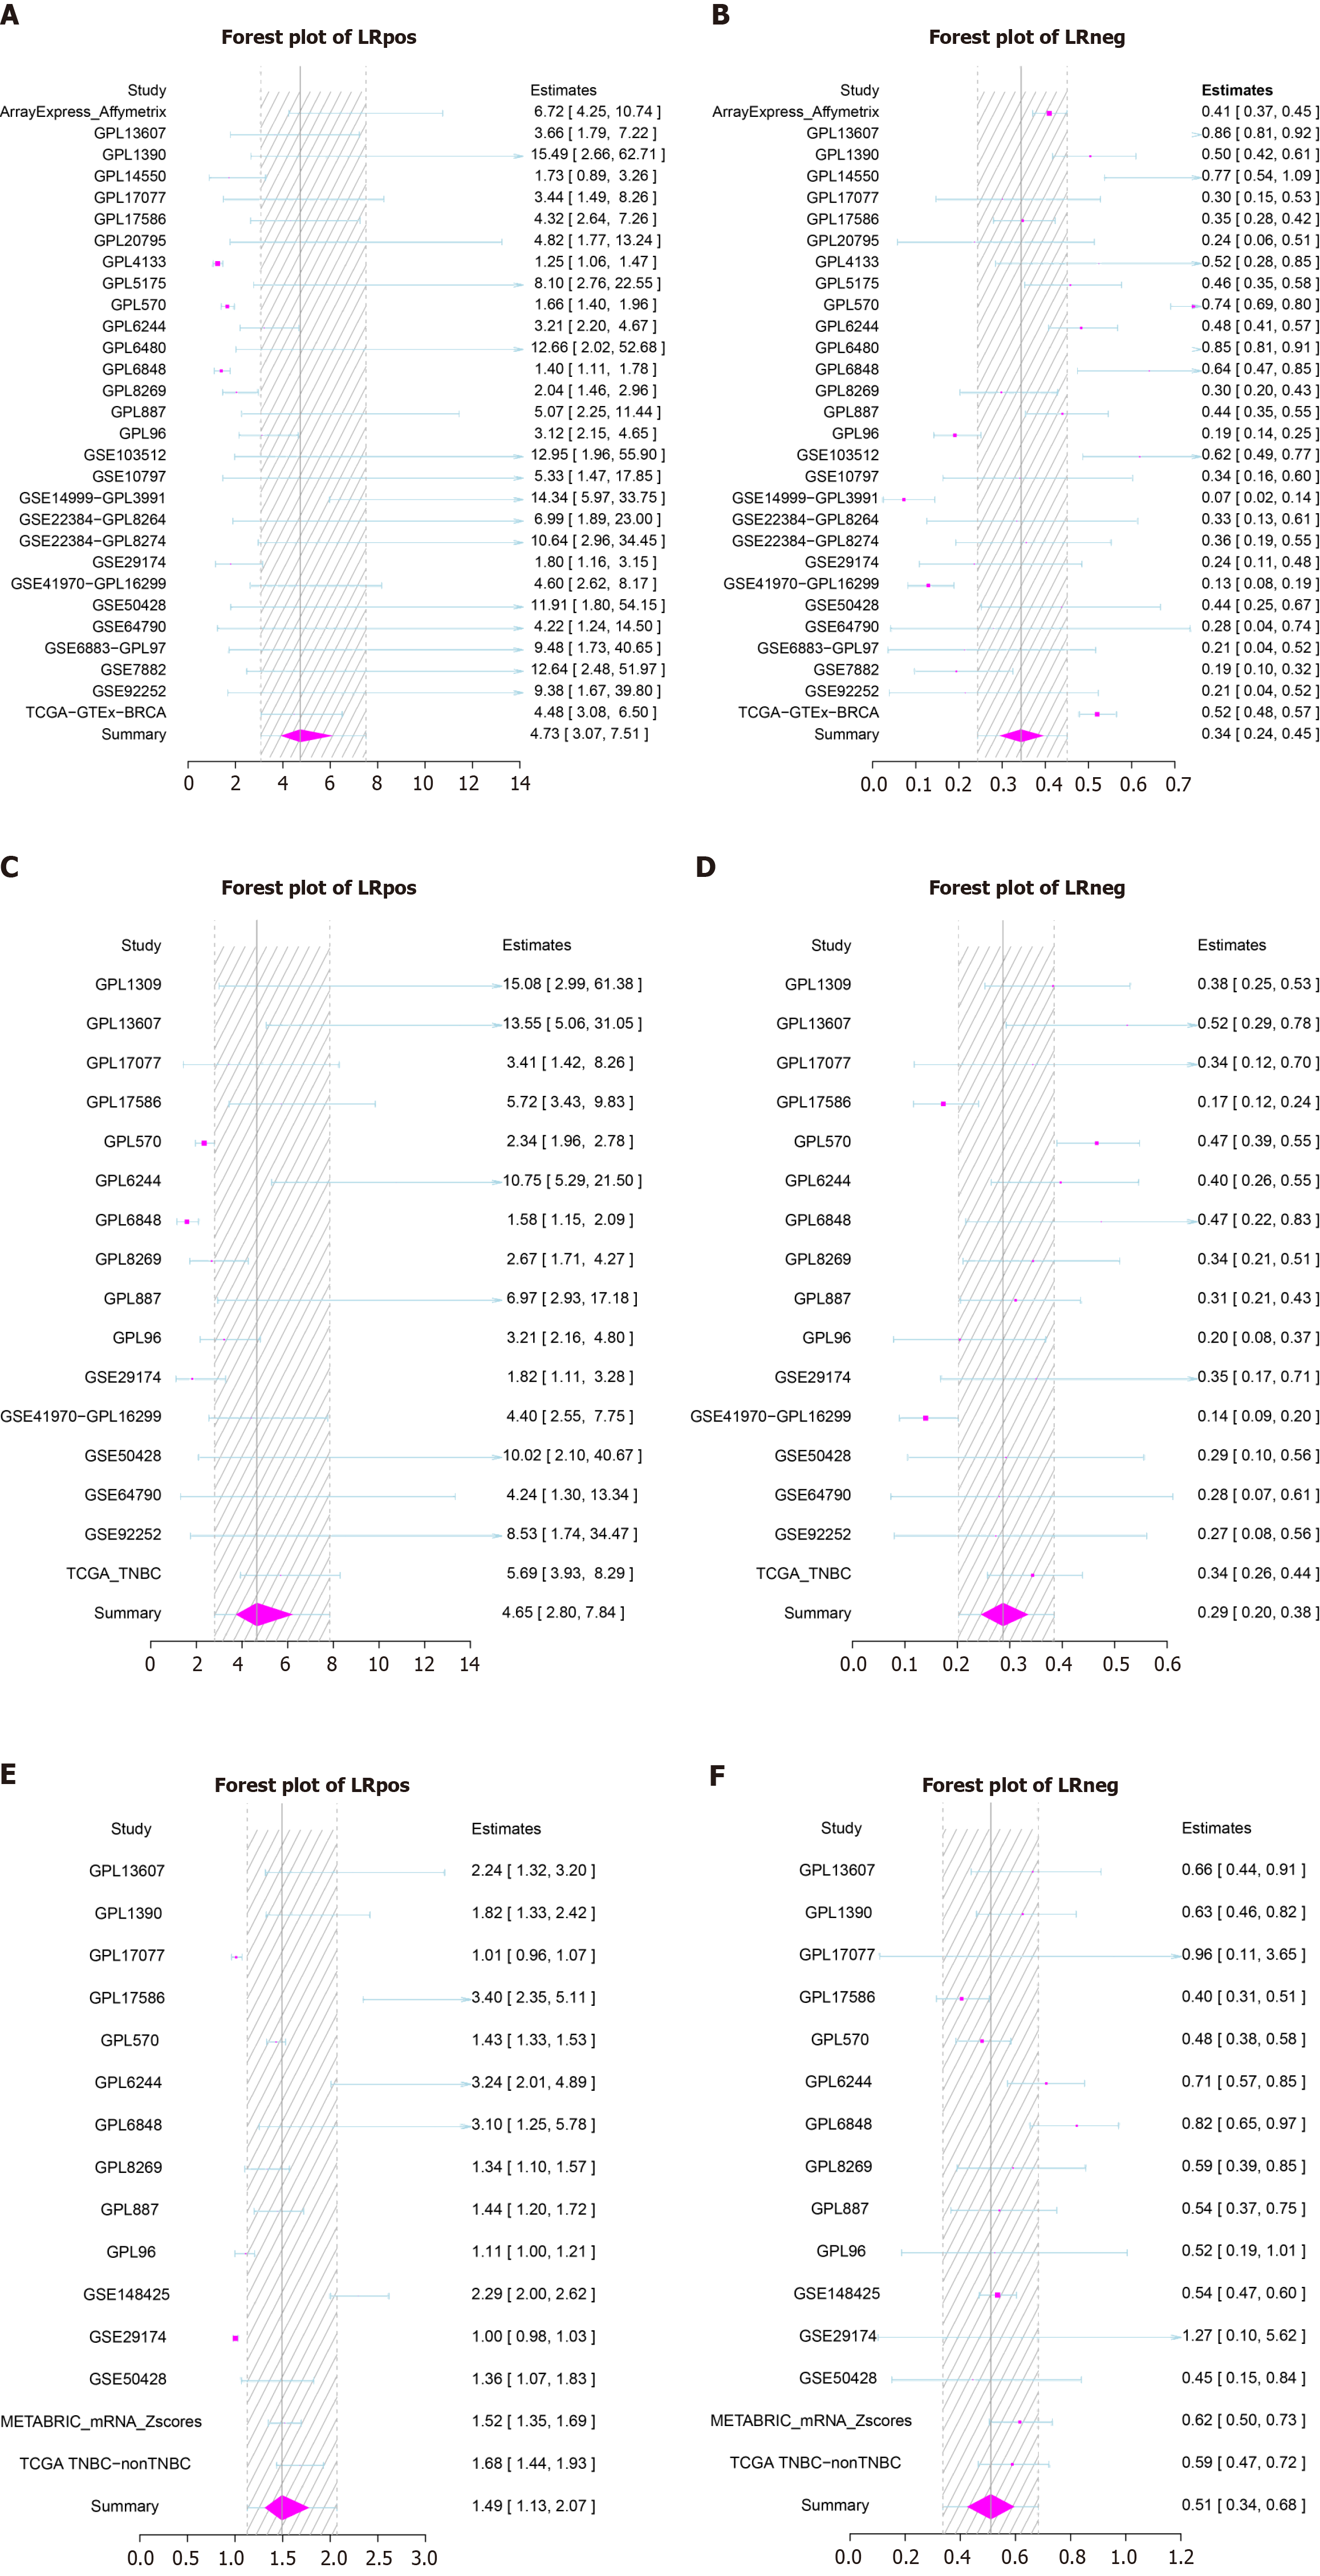
Figure 15 Forest plots of positive likelihood ratio (LRpos) and negative likelihood ratio (LRneg) for phosphoglycerate kinase 1 expression based on different groups.
A and B: Breast cancer (BC) vs normal breast tissue; C and D: Triple-negative BC (TNBC) vs normal breast tissue; E and F: TNBC vs non-TNBC tissue.
- Citation: Chen JY, Li JD, He RQ, Huang ZG, Chen G, Zou W. Bibliometric analysis of phosphoglycerate kinase 1 expression in breast cancer and its distinct upregulation in triple-negative breast cancer. World J Clin Oncol 2024; 15(7): 867-894
- URL: https://www.wjgnet.com/2218-4333/full/v15/i7/867.htm
- DOI: https://dx.doi.org/10.5306/wjco.v15.i7.867


