Copyright
©The Author(s) 2024.
World J Clin Oncol. Jul 24, 2024; 15(7): 867-894
Published online Jul 24, 2024. doi: 10.5306/wjco.v15.i7.867
Published online Jul 24, 2024. doi: 10.5306/wjco.v15.i7.867
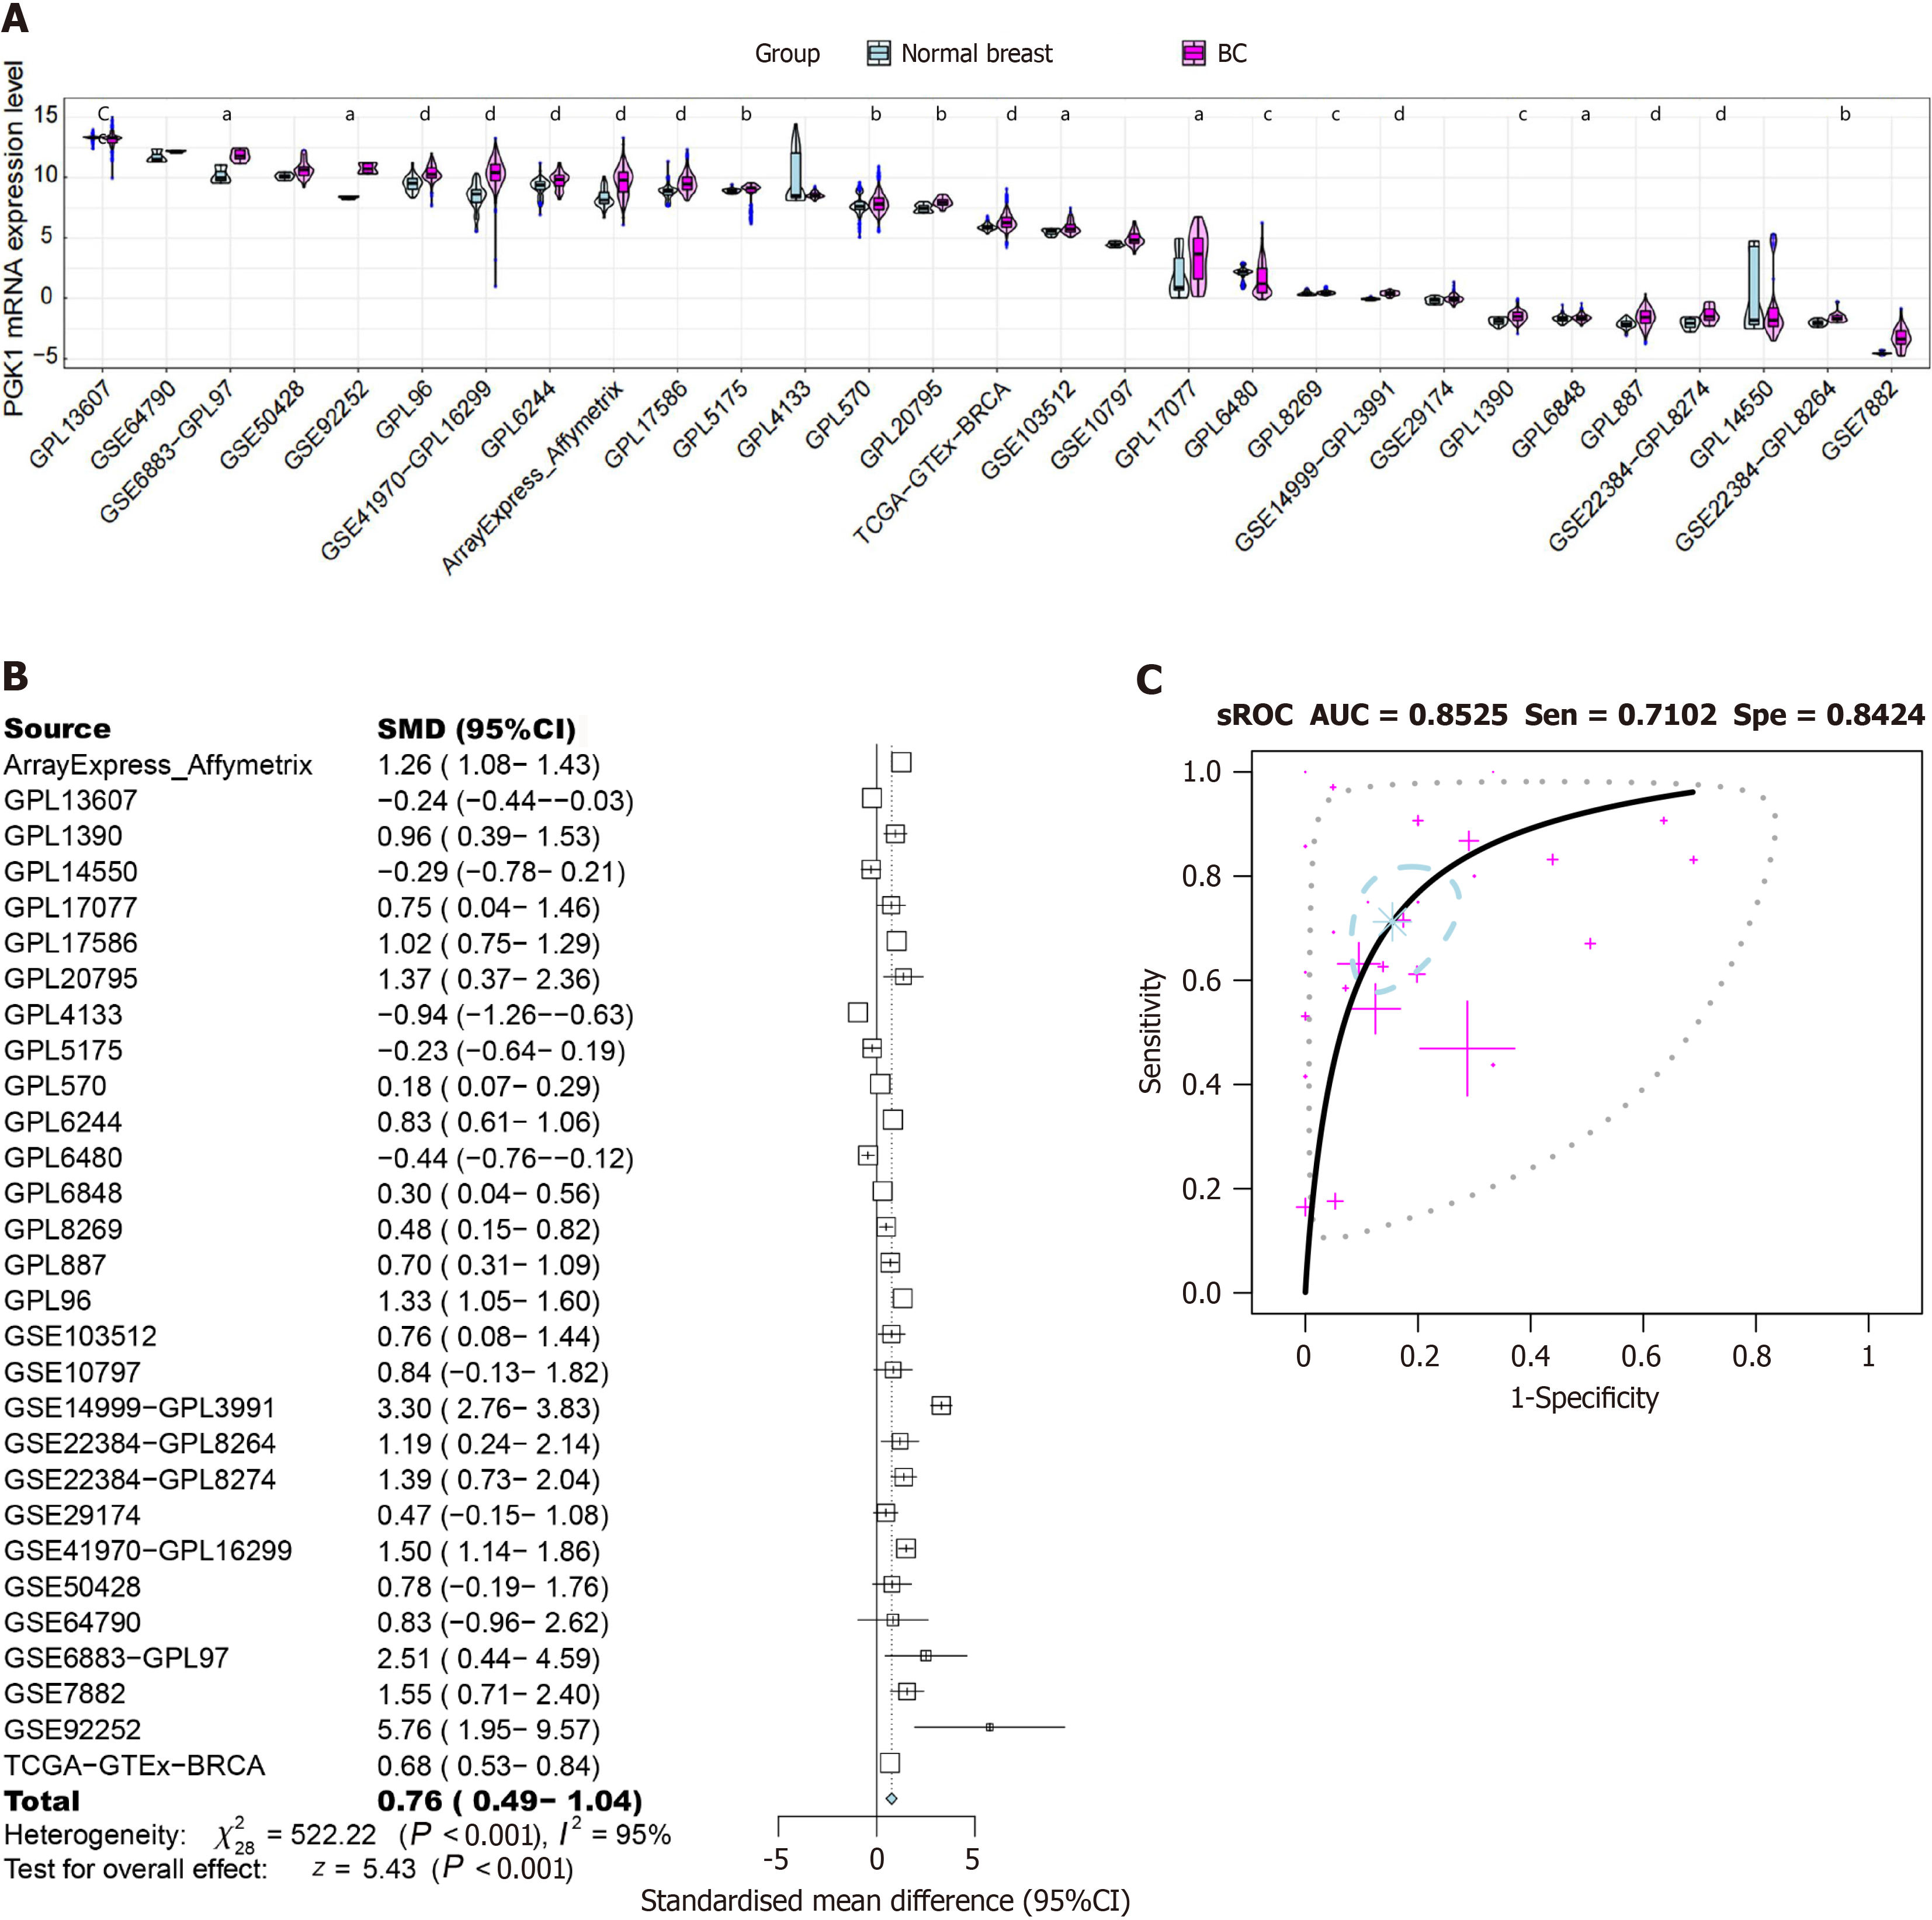
Figure 7 Expression levels of phosphoglycerate kinase 1 in breast cancer tissue vs normal breast tissue.
A: mRNA expression level; B: Standardized mean differences; C: Summary receiver operating characteristic curves. aP < 0.05; bP < 0.01; cP < 0.001; dP < 0.0001. BC: Breast cancer; sROC: Summary receiver operating characteristic curve; AUC: Area under the curve; Sen: Sensitivity; Spe: Specificity; SMD: Standardized mean difference; 95%CI: 95% confidence interval.
- Citation: Chen JY, Li JD, He RQ, Huang ZG, Chen G, Zou W. Bibliometric analysis of phosphoglycerate kinase 1 expression in breast cancer and its distinct upregulation in triple-negative breast cancer. World J Clin Oncol 2024; 15(7): 867-894
- URL: https://www.wjgnet.com/2218-4333/full/v15/i7/867.htm
- DOI: https://dx.doi.org/10.5306/wjco.v15.i7.867


