Copyright
©The Author(s) 2024.
World J Clin Oncol. Jul 24, 2024; 15(7): 867-894
Published online Jul 24, 2024. doi: 10.5306/wjco.v15.i7.867
Published online Jul 24, 2024. doi: 10.5306/wjco.v15.i7.867
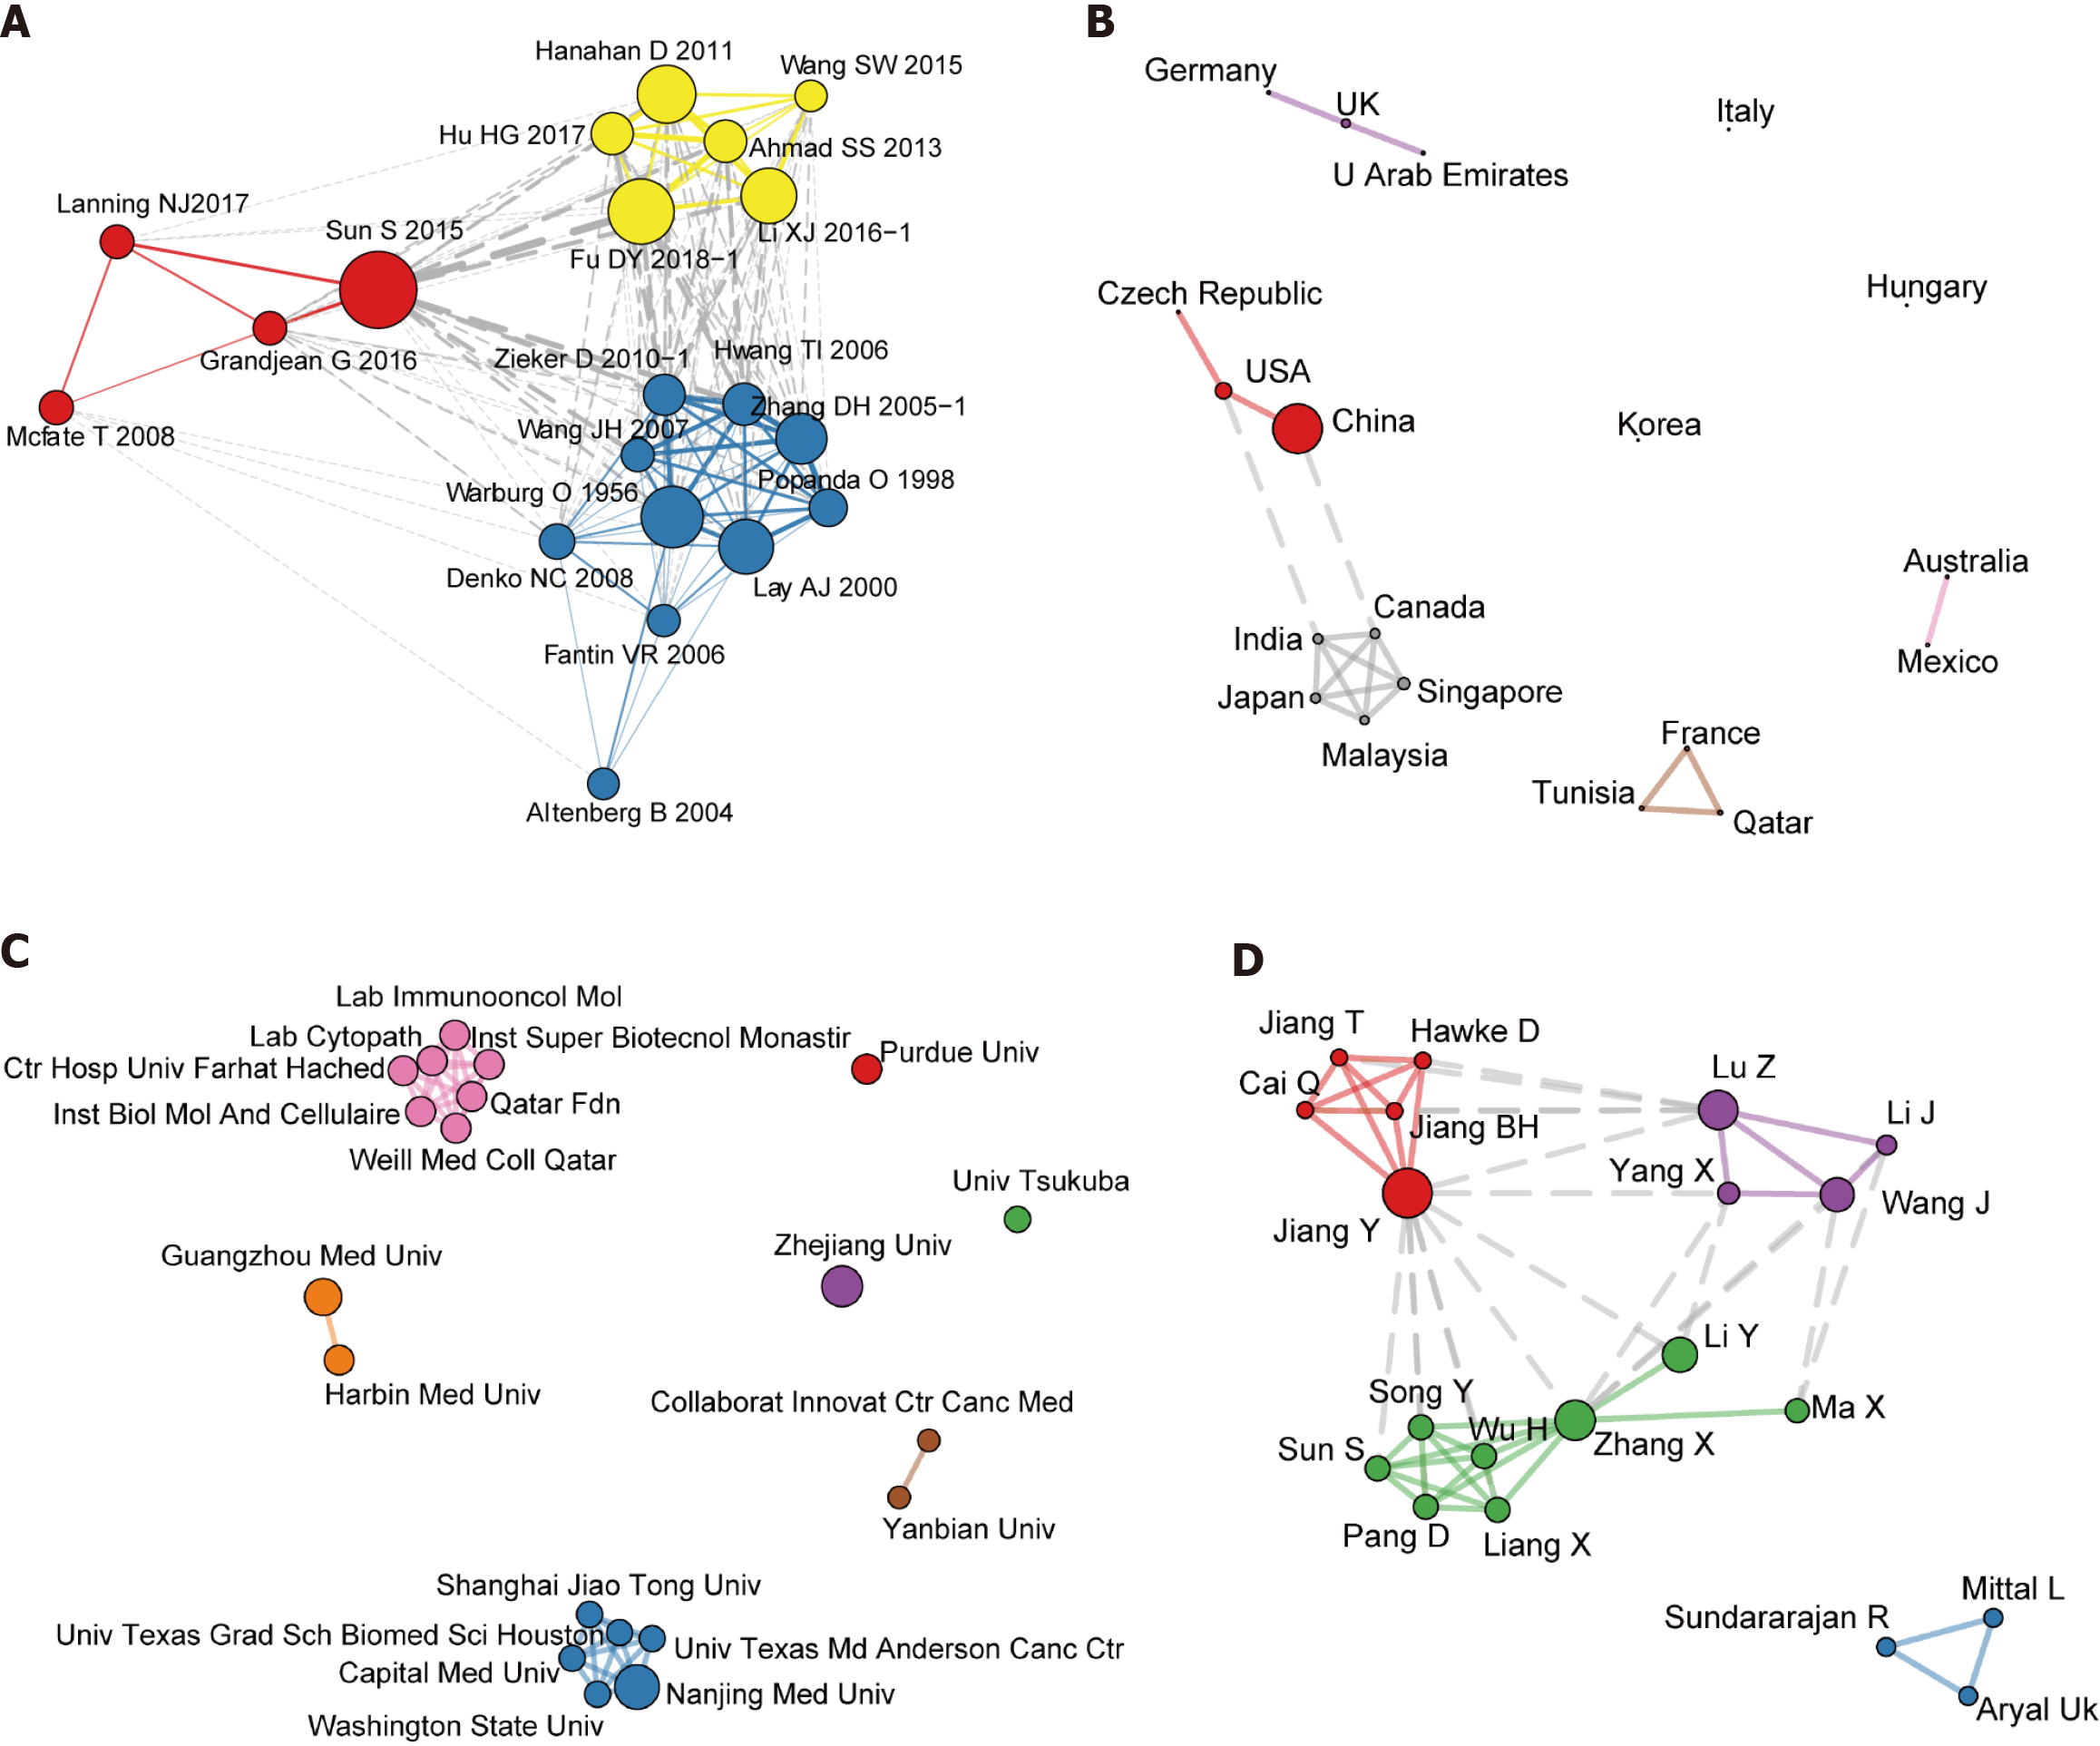
Figure 5 Cooperation network analysis for research on breast cancer and phosphoglycerate kinase 1.
A: Co-citation network; B: Collaborations among countries; C: University collaborations; D: Author collaborations. The co-cited documents and cooperating countries, universities, and authors were clustered using a “leading Eigen” algorithm. Different colors represent different clusters. Node size is positively correlated with the degree of connectivity of each node in the network. Edges indicate a co-citation or collaborative relationship.
- Citation: Chen JY, Li JD, He RQ, Huang ZG, Chen G, Zou W. Bibliometric analysis of phosphoglycerate kinase 1 expression in breast cancer and its distinct upregulation in triple-negative breast cancer. World J Clin Oncol 2024; 15(7): 867-894
- URL: https://www.wjgnet.com/2218-4333/full/v15/i7/867.htm
- DOI: https://dx.doi.org/10.5306/wjco.v15.i7.867


