Copyright
©The Author(s) 2024.
World J Clin Oncol. Jun 24, 2024; 15(6): 765-782
Published online Jun 24, 2024. doi: 10.5306/wjco.v15.i6.765
Published online Jun 24, 2024. doi: 10.5306/wjco.v15.i6.765
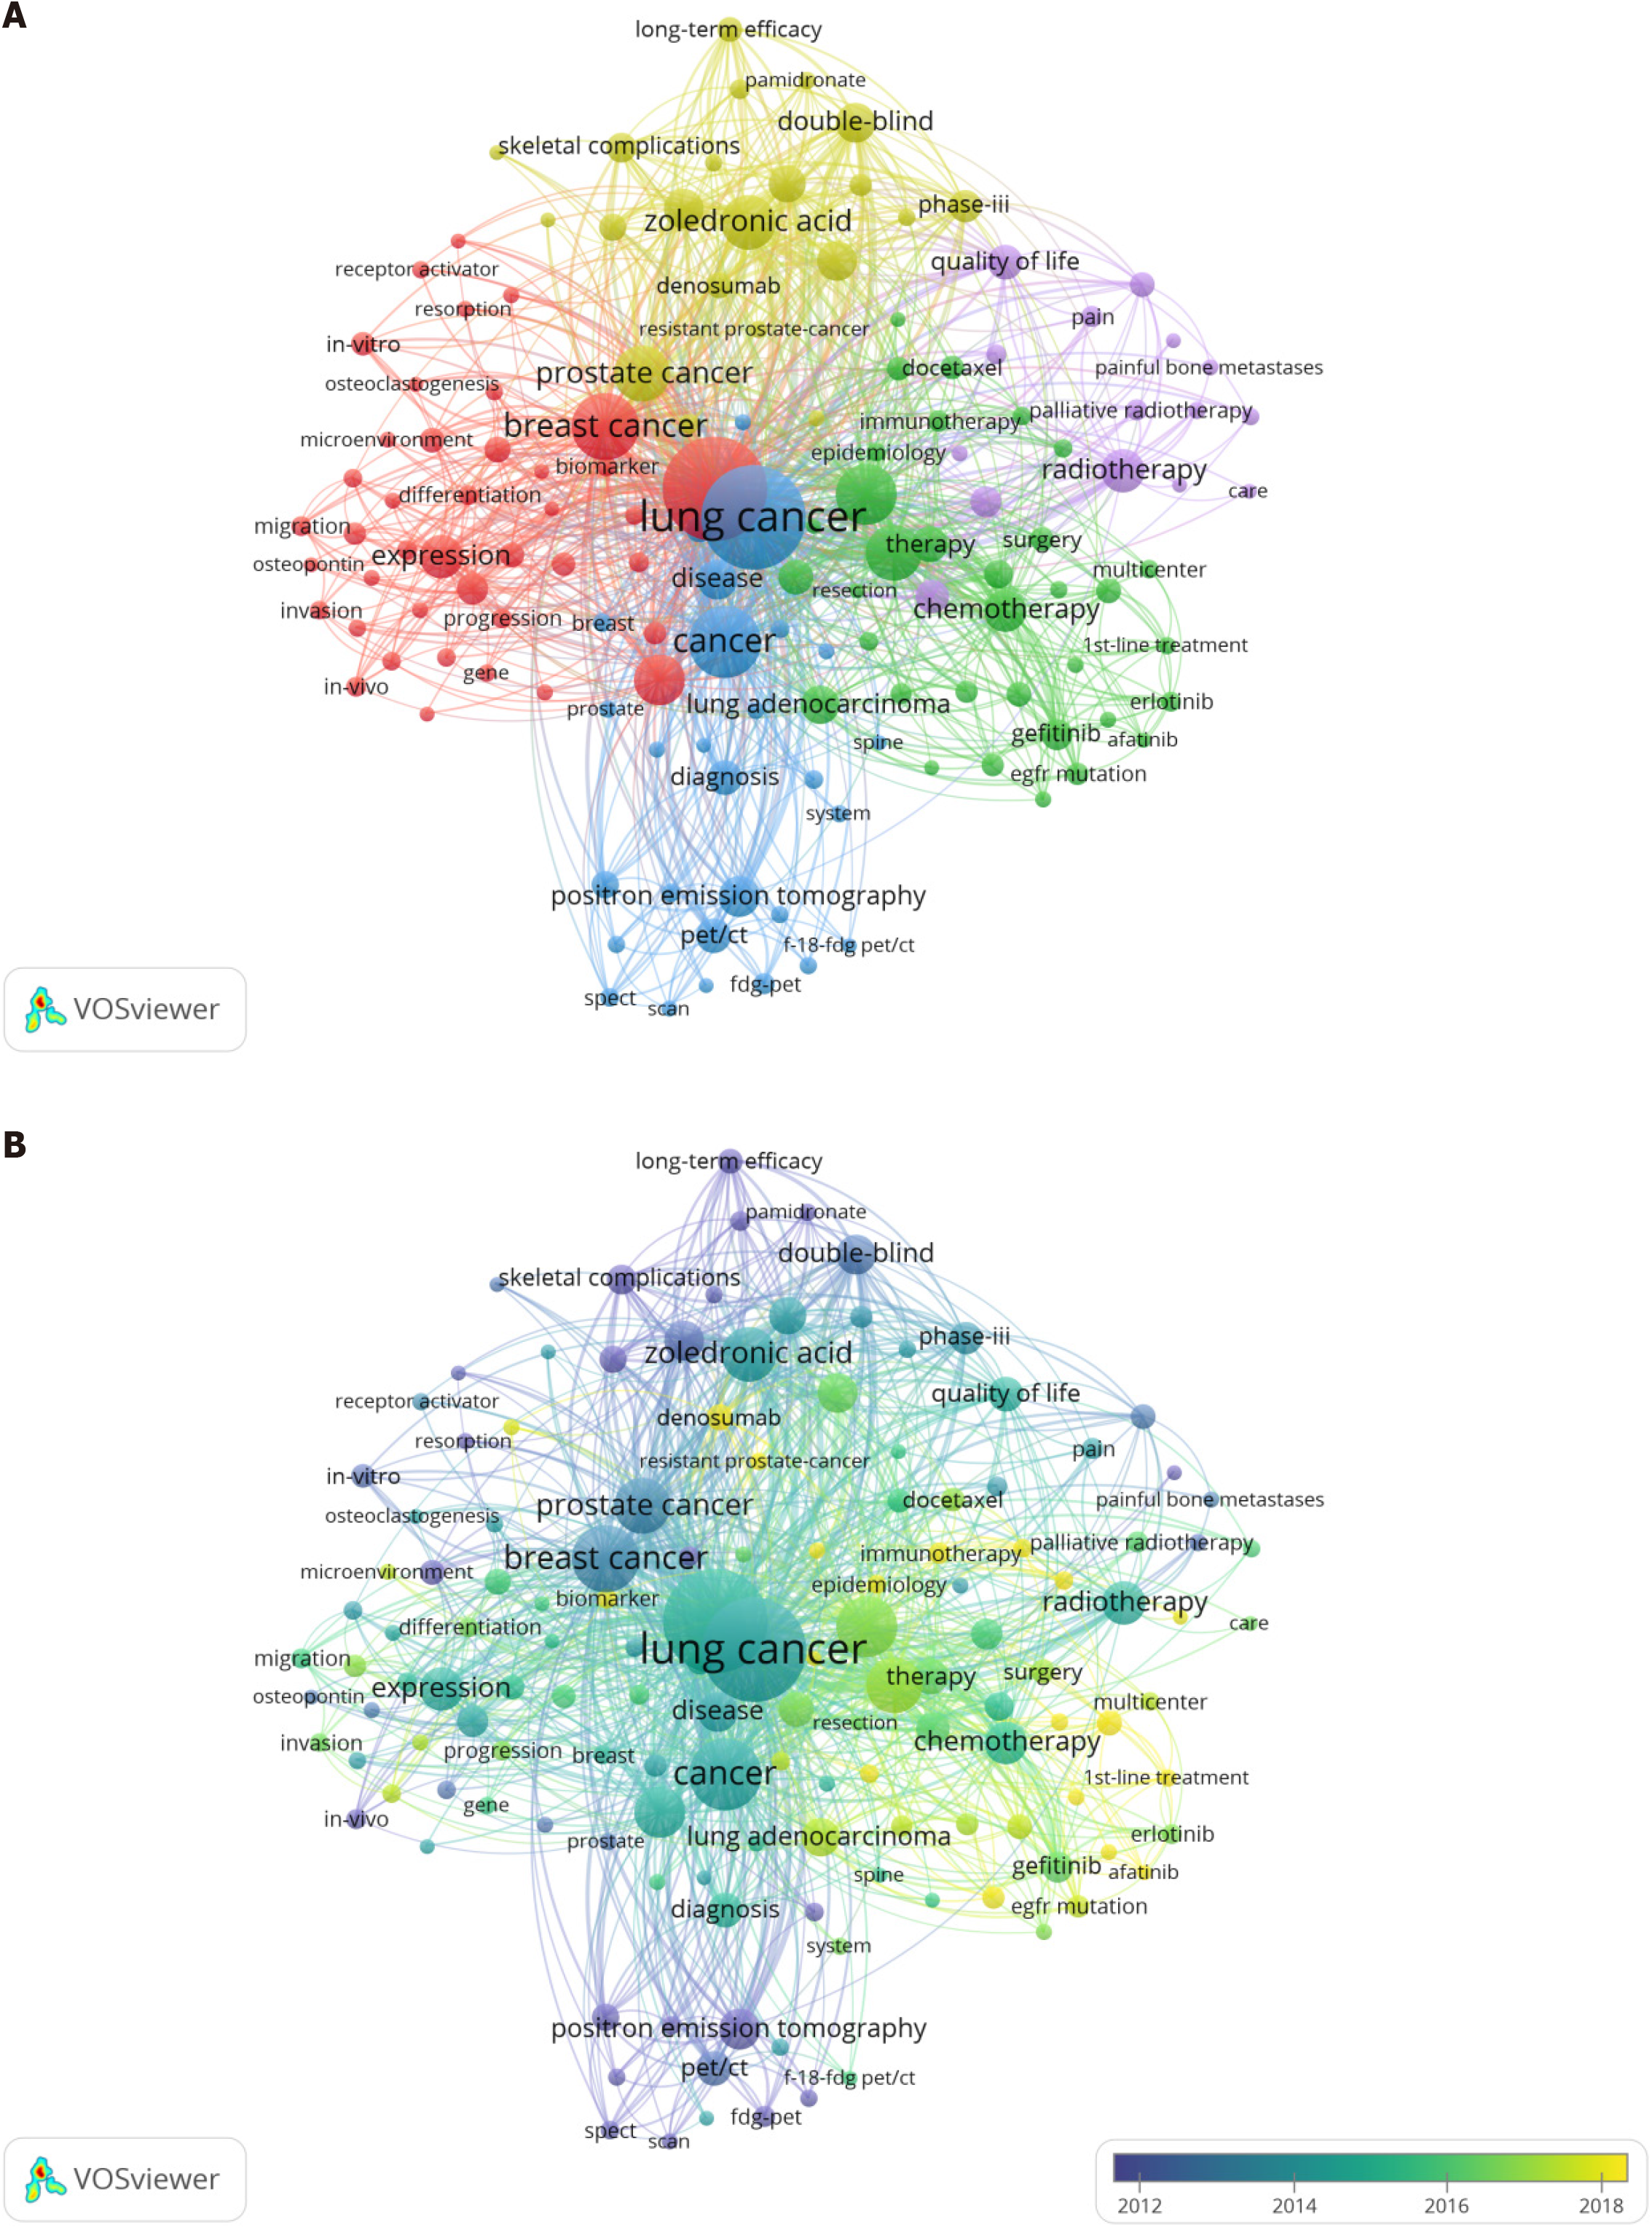
Figure 6 Analysis of the co-occurrence of all keywords.
A: Network visualization map; B: Overlay visualization map. The small circle represents the keyword. The area of the small circle represents the frequency of the keyword. The colors of the different areas represent their categories. The lines of the connecting circles represent keywords that appear in an article at the same time.
- Citation: Chen Y, Chen XS, He RQ, Huang ZG, Lu HP, Huang H, Yang DP, Tang ZQ, Yang X, Zhang HJ, Qv N, Kong JL, Chen G. What enlightenment has the development of lung cancer bone metastasis brought in the last 22 years. World J Clin Oncol 2024; 15(6): 765-782
- URL: https://www.wjgnet.com/2218-4333/full/v15/i6/765.htm
- DOI: https://dx.doi.org/10.5306/wjco.v15.i6.765


