Copyright
©The Author(s) 2024.
World J Clin Oncol. May 24, 2024; 15(5): 614-634
Published online May 24, 2024. doi: 10.5306/wjco.v15.i5.614
Published online May 24, 2024. doi: 10.5306/wjco.v15.i5.614
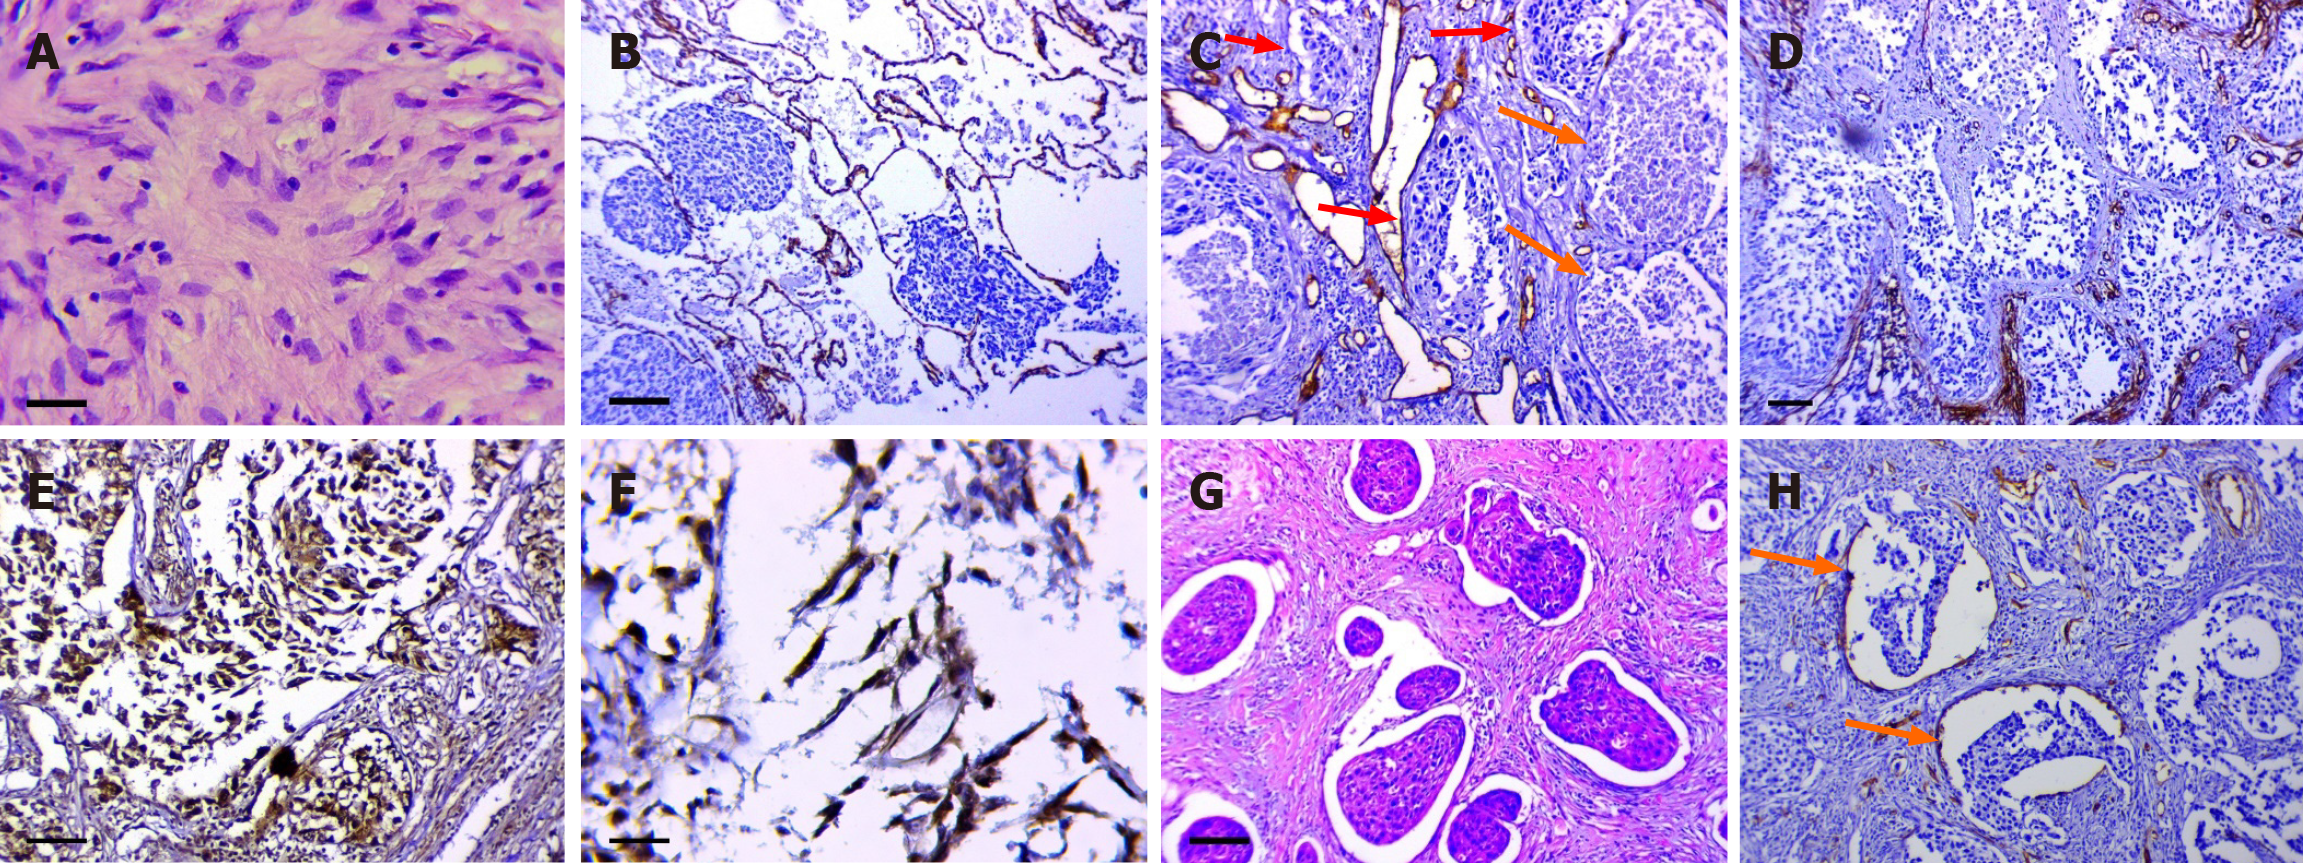
Figure 2 Features of parenchymal and stromal tumor components.
A: Loose, fine fibrous connective tissue in the tumor stroma. Scale bar = 10 μm; B: Tumor spread through the unchanged alveolar air spaces (AASs). Scale bar = 100 μm; C: Spread of the relatively unchanged clusters of tumor cells (red arrows) and the completely necrotic tumor masses (orange arrows) through the AASs having thickened walls with dilated capillaries. Scale bar = 100 μm; D: Fragmentation of the tumor masses spreading through the AASs. Scale bar = 100 μm; E: Positive nuclear expression of hypoxia-inducible factor-1 alpha (HIF-1a) in fibroblast-like tumor cells. Scale bar = 10 μm; F: Positive nuclear expression of Snail in fibroblast-like tumor cells. Scale bar = 10 μm; G: Retraction clefts. Scale bar = 100 μm; H: Structures with partial endothelial lining (orange arrows). Scale bar = 100 μm. A and G: Mayer's hematoxylin and eosin staining; B, C and H: Staining with antibodies against cluster of differentiation 34; E: Staining with antibodies against HIF-1a; F: Staining with antibodies against Snail.
- Citation: Senchukova MA, Kalinin EA, Volchenko NN. Different types of tumor microvessels in stage I-IIIA squamous cell lung cancer and their clinical significance. World J Clin Oncol 2024; 15(5): 614-634
- URL: https://www.wjgnet.com/2218-4333/full/v15/i5/614.htm
- DOI: https://dx.doi.org/10.5306/wjco.v15.i5.614


