Copyright
©The Author(s) 2024.
World J Clin Oncol. Apr 24, 2024; 15(4): 554-565
Published online Apr 24, 2024. doi: 10.5306/wjco.v15.i4.554
Published online Apr 24, 2024. doi: 10.5306/wjco.v15.i4.554
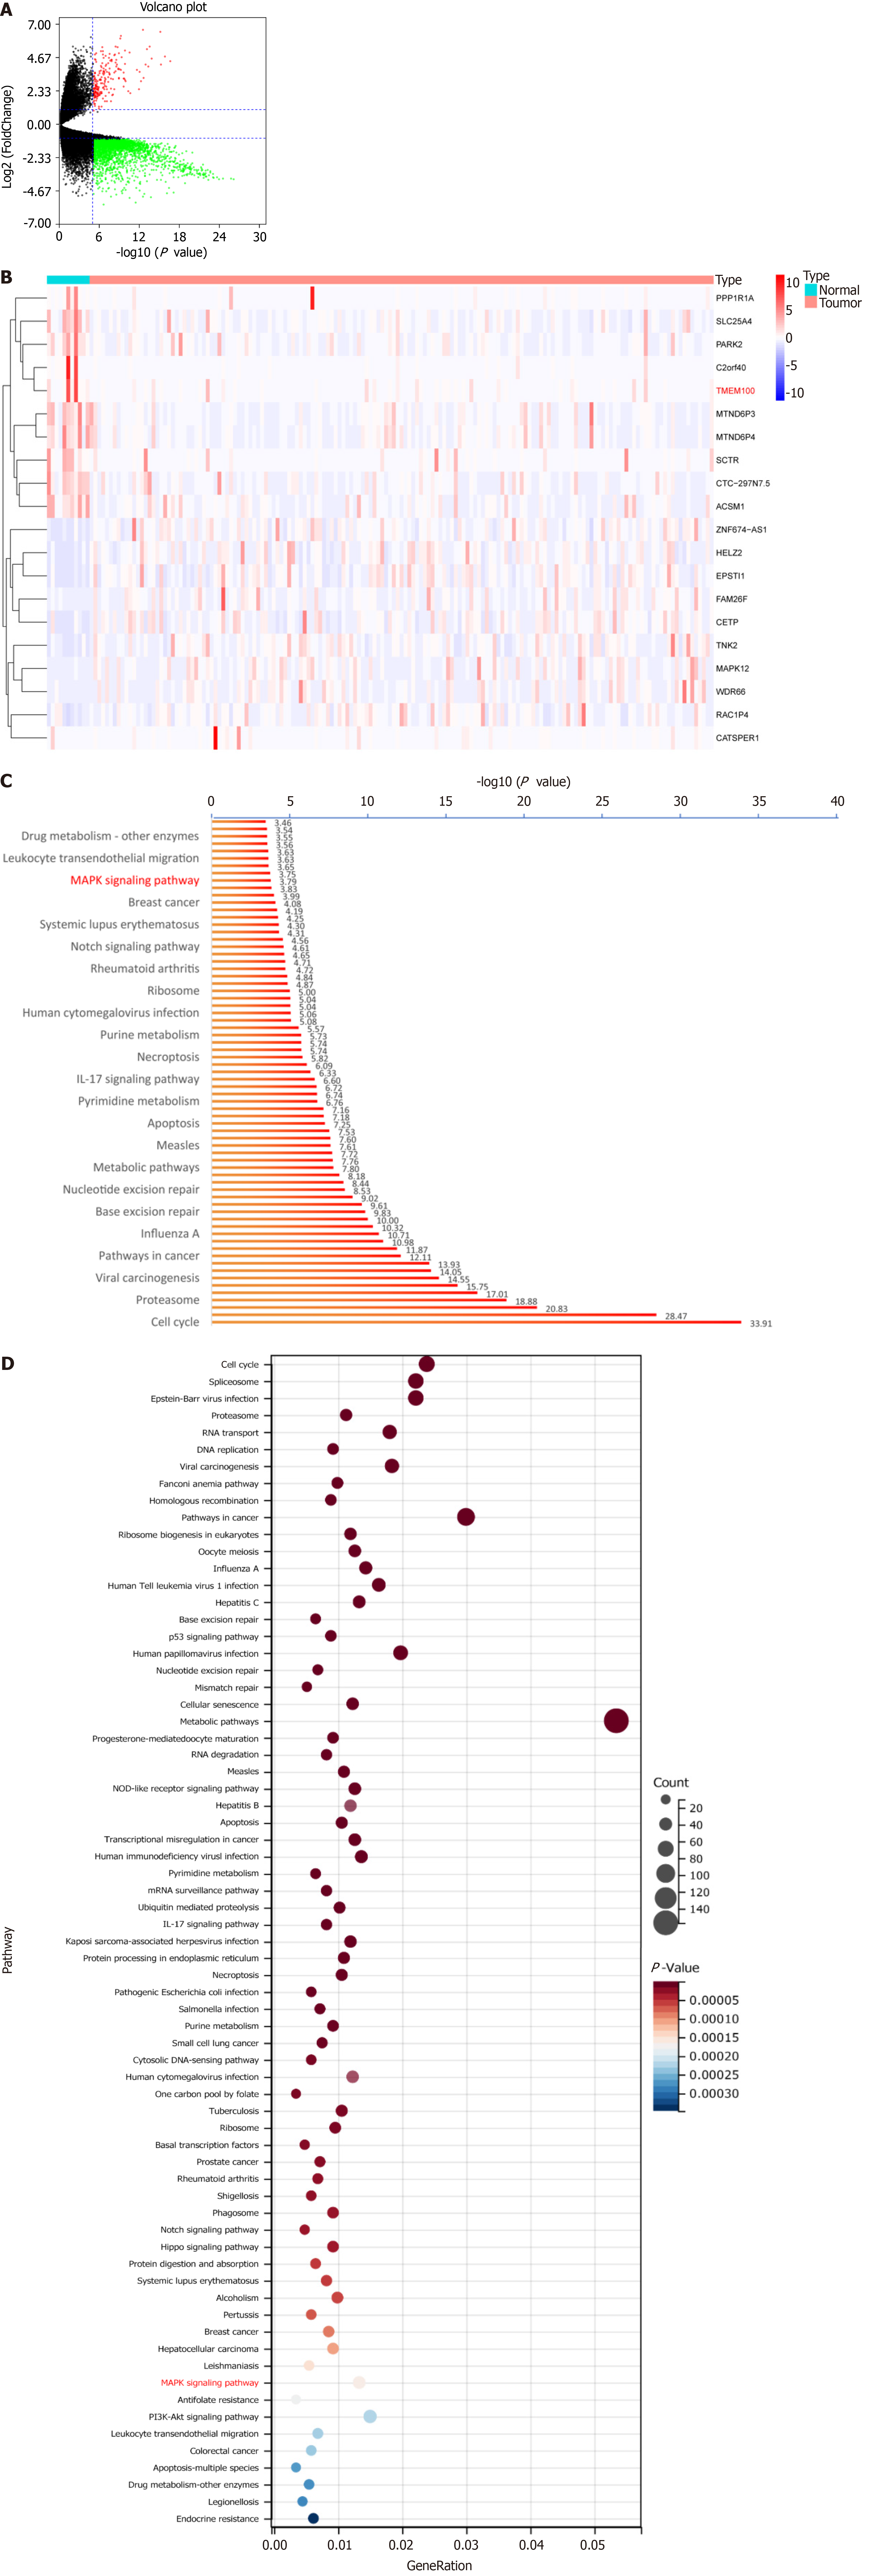
Figure 3 Identification of differentially expressed genes and functional enrichment analysis.
A: In the volcano plot, upregulated genes are indicated by red dots, and downregulated genes are indicated by green dots; B: The heatmap represents the expression levels of the genes, with the blue to red spectrum indicating low to high expression; C and D: The top 69 enriched Kyoto Encyclopedia of Genes and Genomes pathways.
- Citation: Xu YF, Dang Y, Kong WB, Wang HL, Chen X, Yao L, Zhao Y, Zhang RQ. Regulation of TMEM100 expression by epigenetic modification, effects on proliferation and invasion of esophageal squamous carcinoma. World J Clin Oncol 2024; 15(4): 554-565
- URL: https://www.wjgnet.com/2218-4333/full/v15/i4/554.htm
- DOI: https://dx.doi.org/10.5306/wjco.v15.i4.554


