Copyright
©The Author(s) 2024.
World J Clin Oncol. Mar 24, 2024; 15(3): 434-446
Published online Mar 24, 2024. doi: 10.5306/wjco.v15.i3.434
Published online Mar 24, 2024. doi: 10.5306/wjco.v15.i3.434
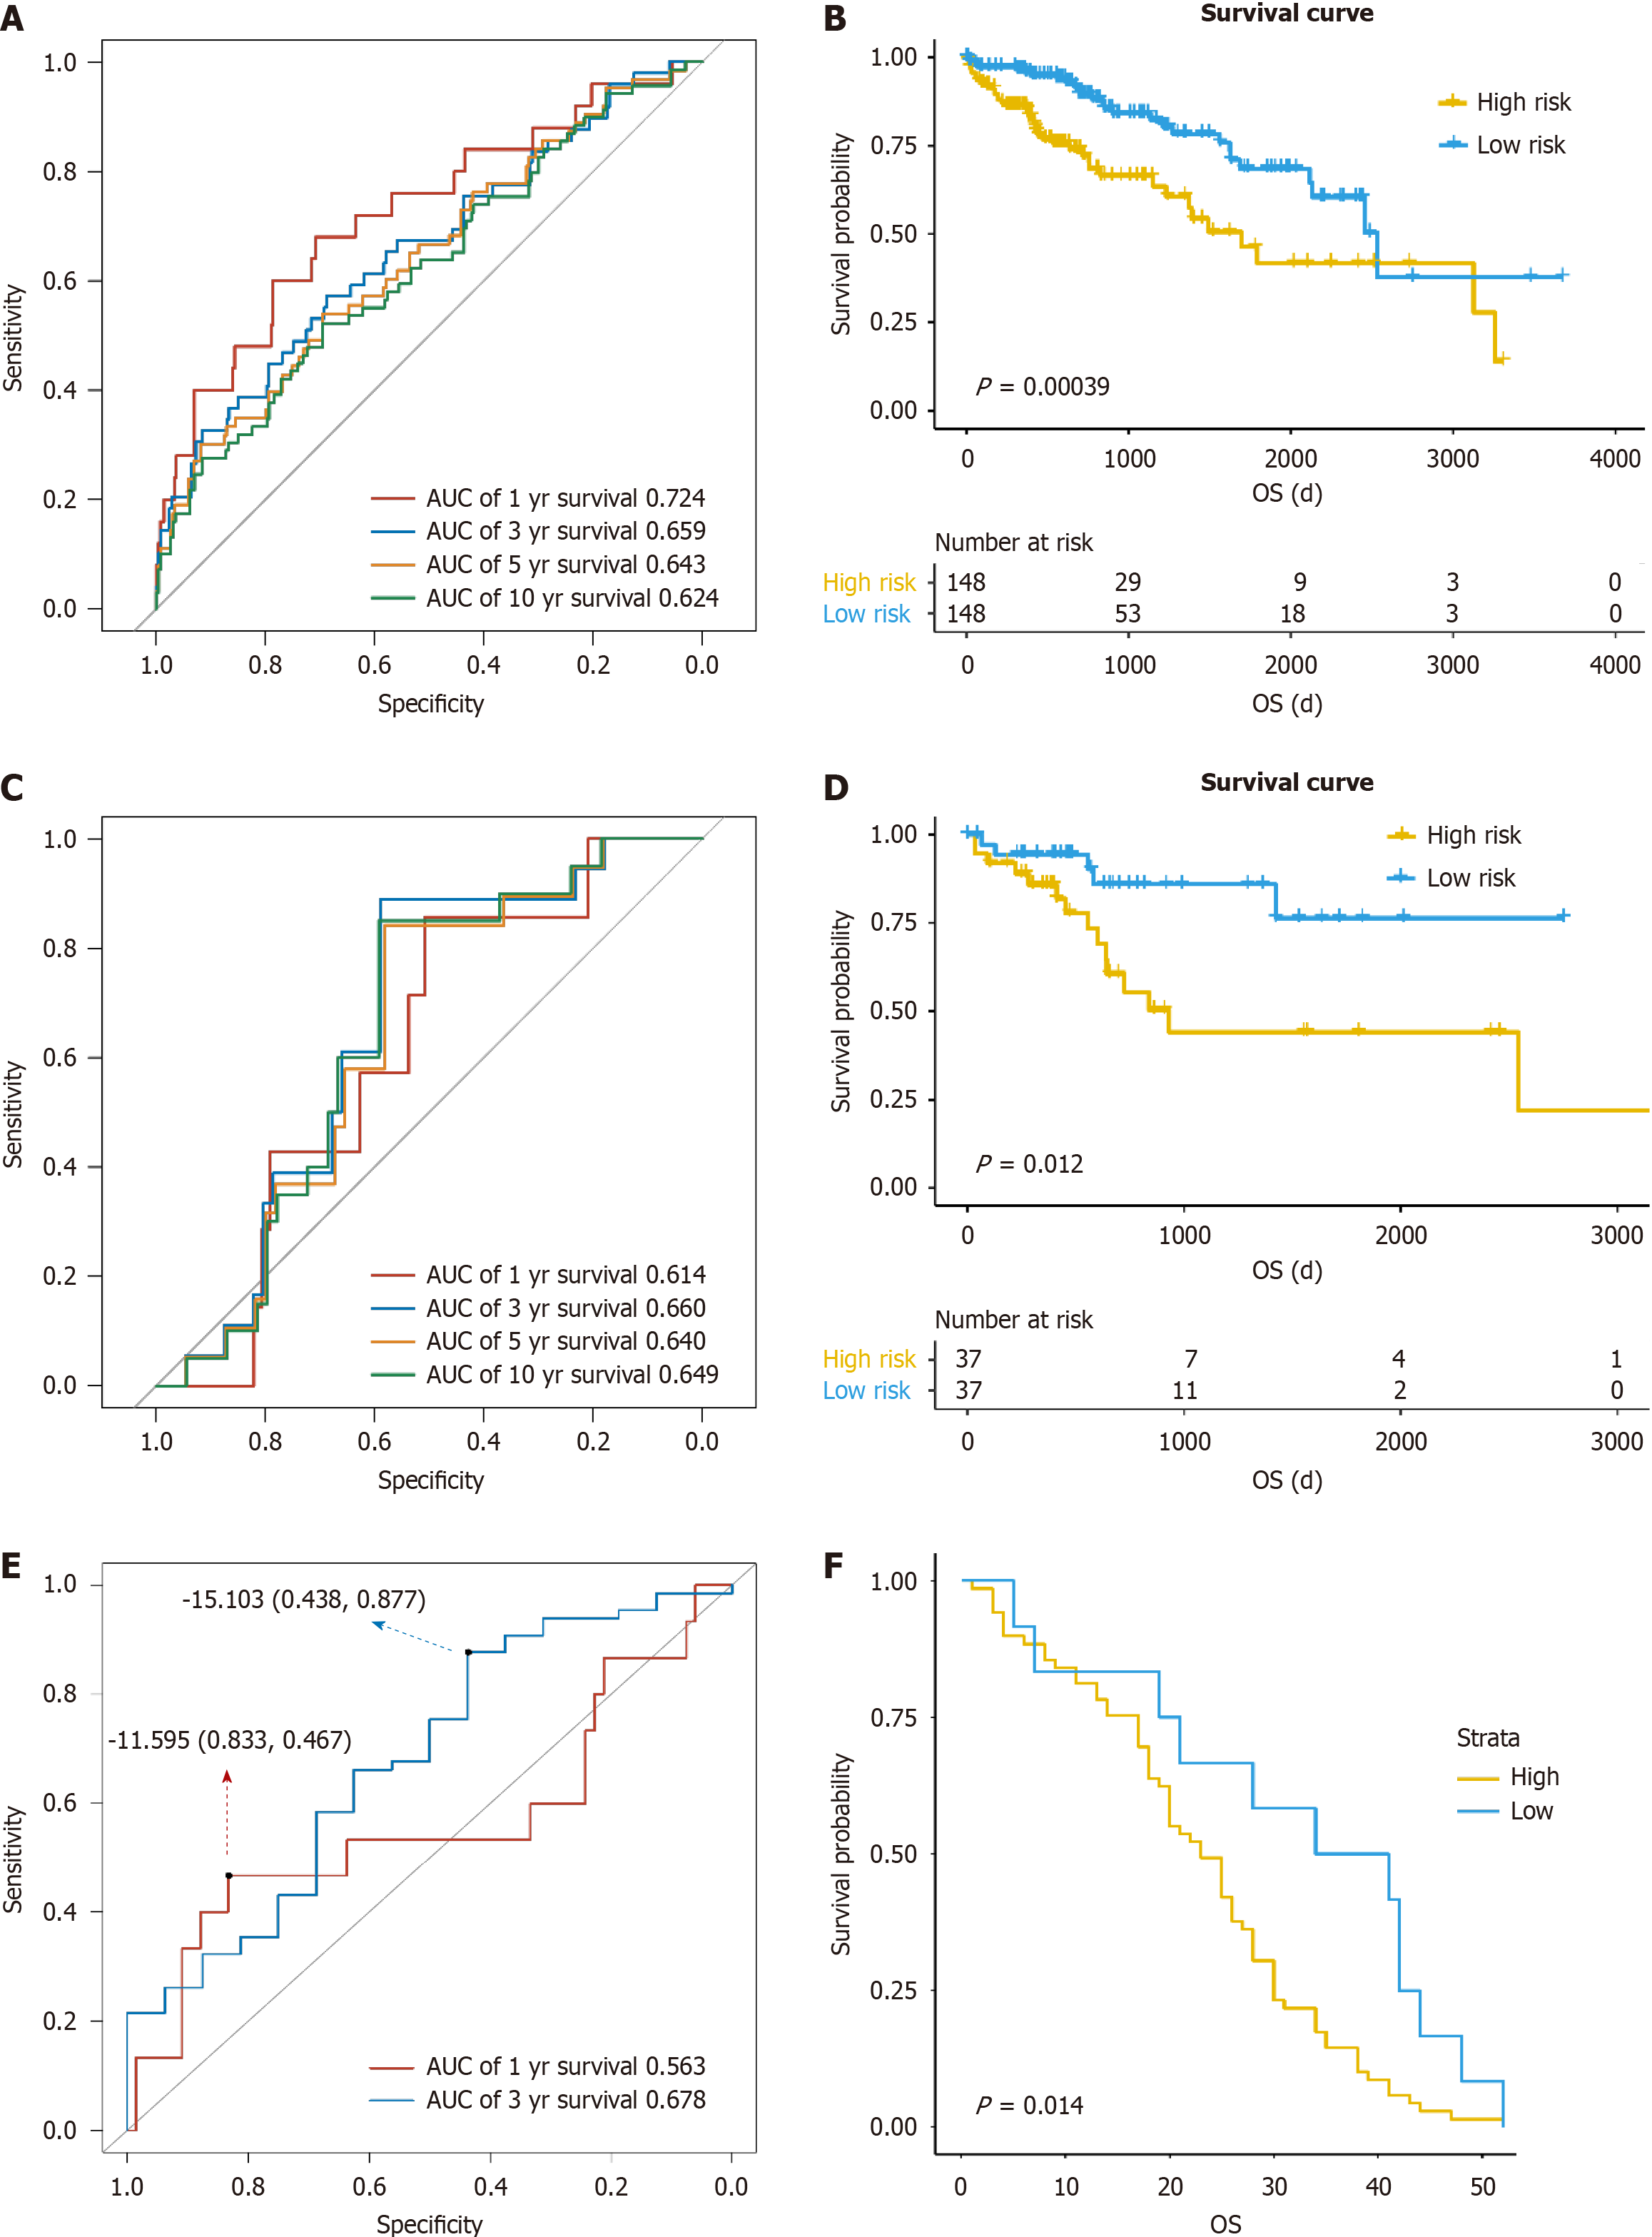
Figure 1 Prognosis predictive model for liver cancer.
A: Receiver operating characteristic (ROC) curve of the model in training group; B: Survival curve of high- and low-risk patients with liver cancer in training group; C: ROC curve of the model in The Cancer Genome Atlas (TCGA) validation group; D: Survival curve of high- and low-risk patients with liver cancer in TCGA validation group; E: ROC curve of the model in gene expression comprehensive (GEO) validation group; F: Survival curve of high- and low-risk patients with liver cancer in GEO validation group. AUC: Area under the curve; OS: Overall survival.
- Citation: Li H, Ma YP, Wang HL, Tian CJ, Guo YX, Zhang HB, Liu XM, Liu PF. Establishment of a prognosis predictive model for liver cancer based on expression of genes involved in the ubiquitin-proteasome pathway. World J Clin Oncol 2024; 15(3): 434-446
- URL: https://www.wjgnet.com/2218-4333/full/v15/i3/434.htm
- DOI: https://dx.doi.org/10.5306/wjco.v15.i3.434


