Copyright
©The Author(s) 2024.
World J Clin Oncol. Mar 24, 2024; 15(3): 419-433
Published online Mar 24, 2024. doi: 10.5306/wjco.v15.i3.419
Published online Mar 24, 2024. doi: 10.5306/wjco.v15.i3.419
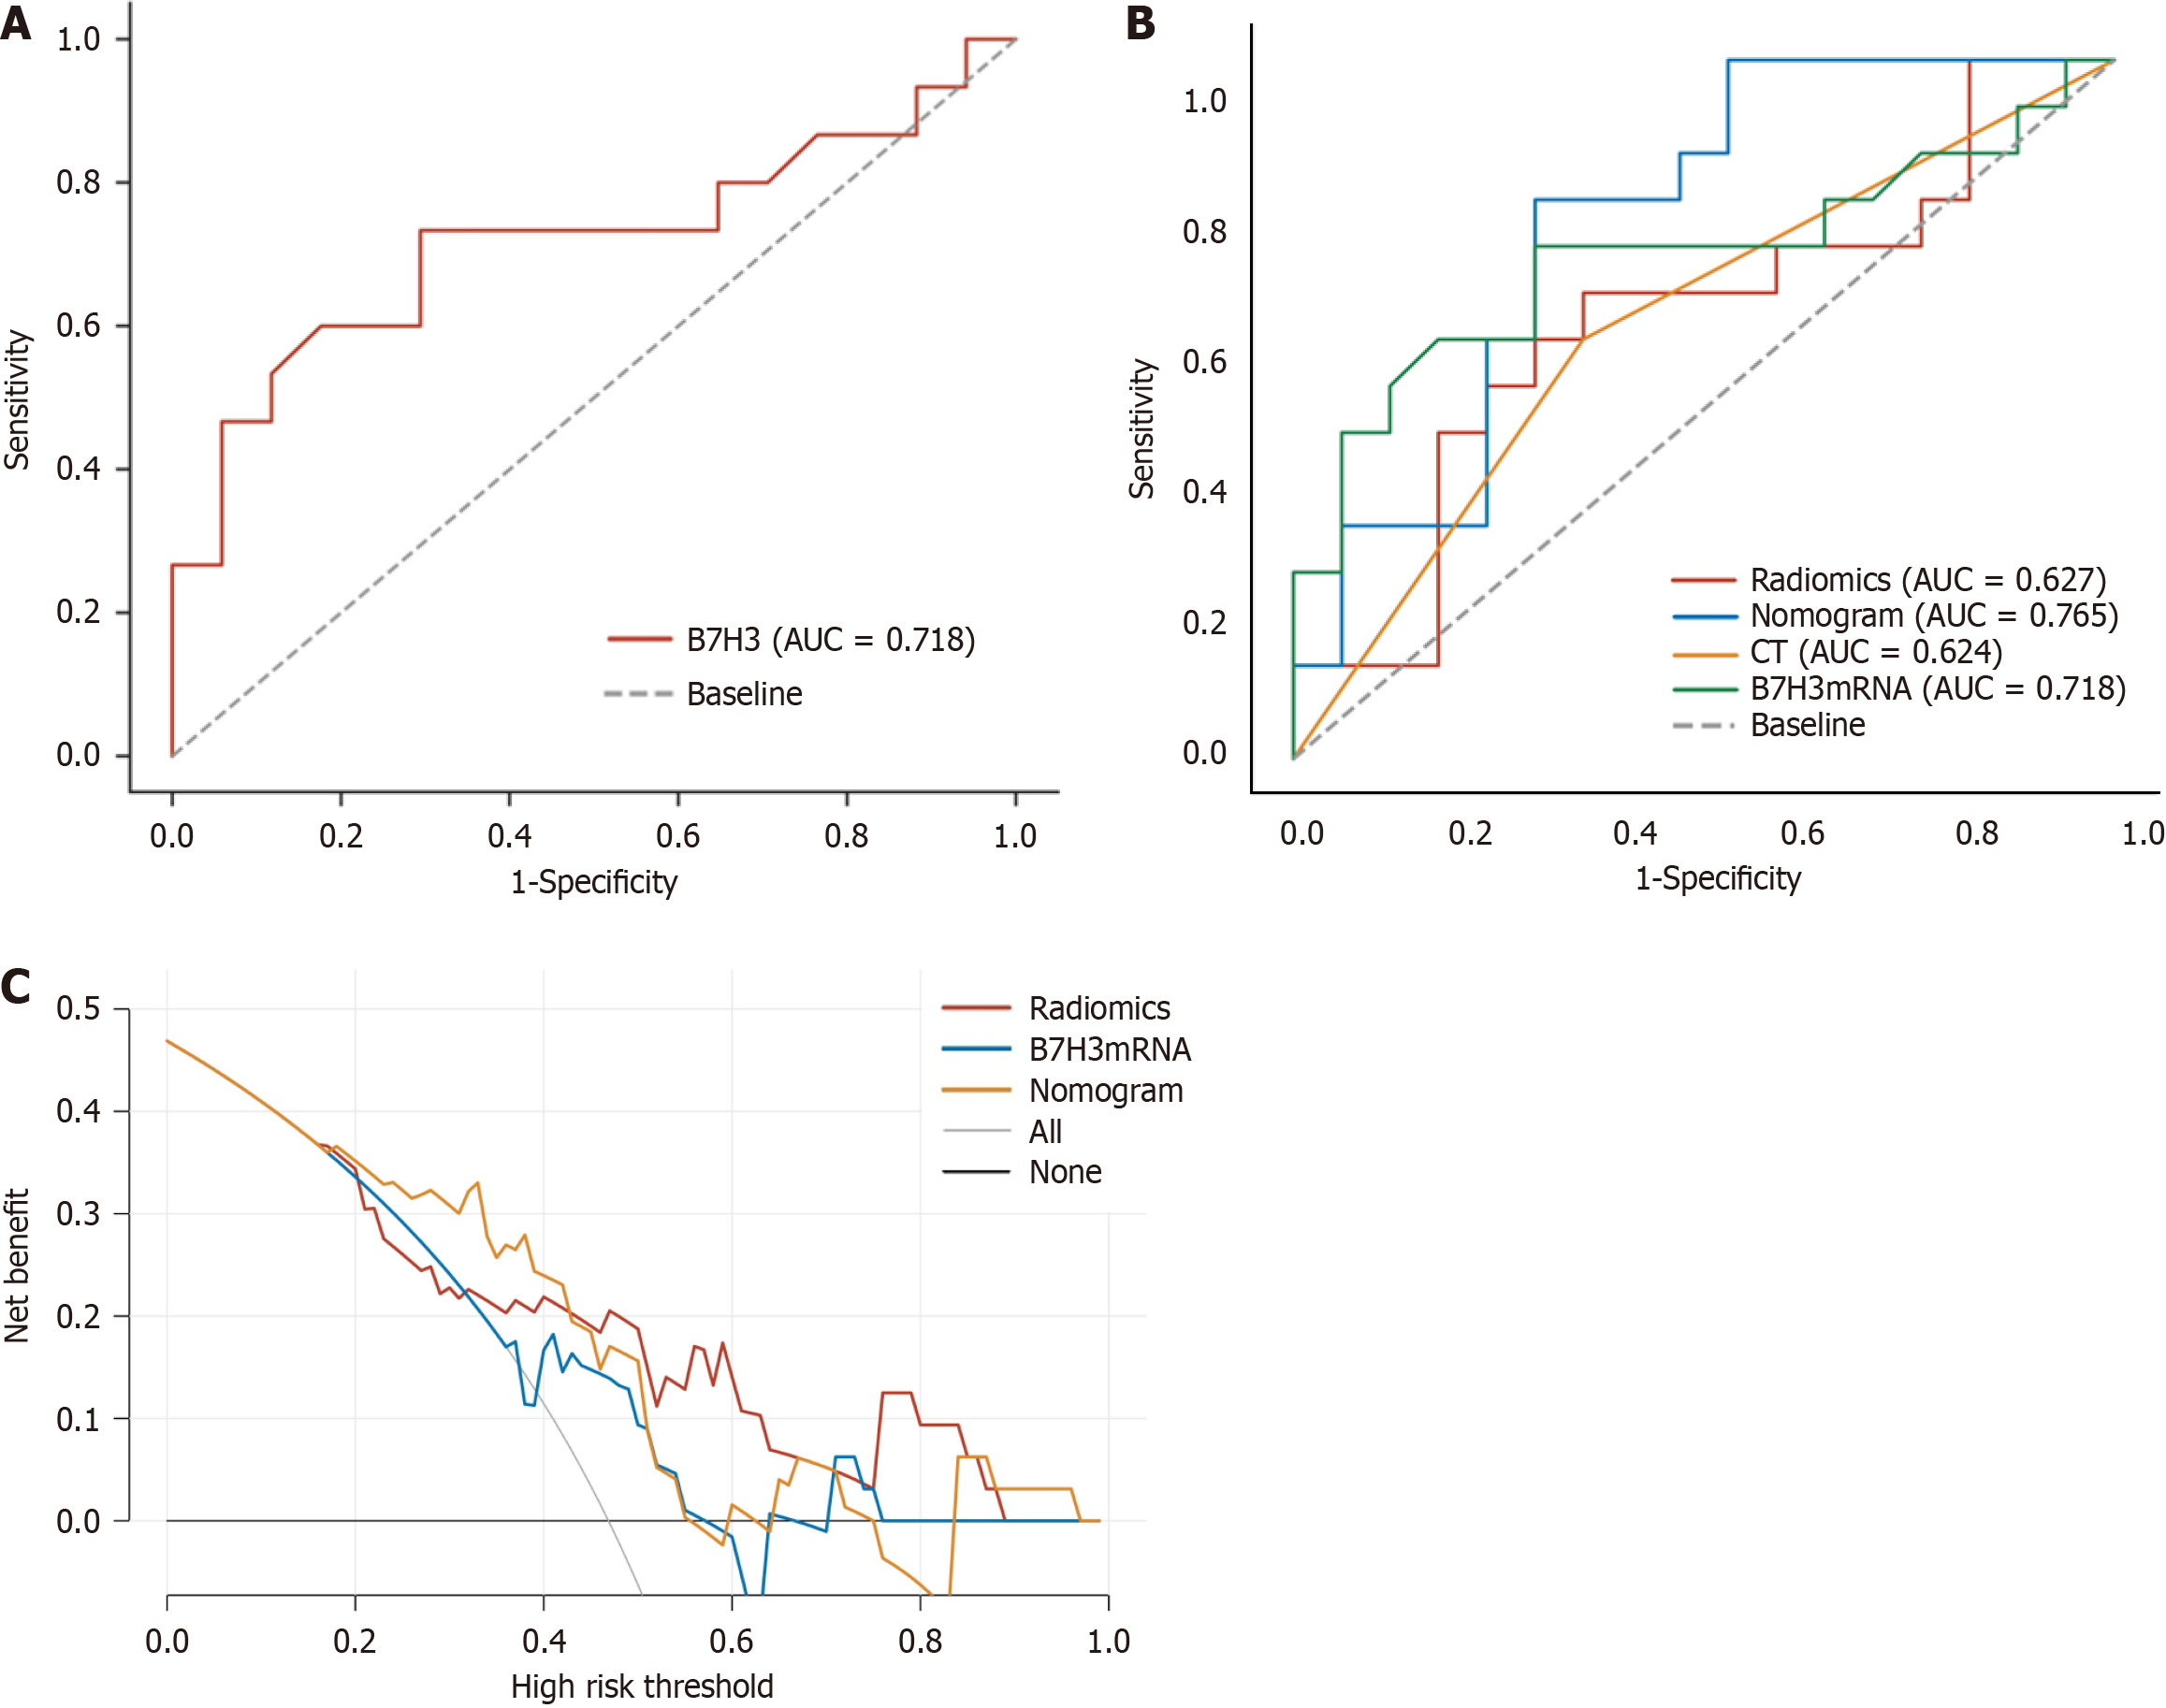
Figure 2 Receiver operating characteristic curve, the area under the receiver operating characteristic curve, and decision curve analysis.
A: Receiver operating characteristic (ROC) curve of B7-H3mRNA in the study queue; B: Model performance in the study cohort. the area under the ROC curve (AUC) value increases when radiomic features are combined with B7-H3 mRNA expression compared to different feature combinations. Additionally, it can be observed that as more feature species are used, the AUC value increases, indicating better model performance; C: Decision curve analysis. The y-axis represents net benefit. The threshold probability refers to the point at which the perceived benefit of treating patients with intermediate to high-risk lymph node metastasis is considered equivalent to the harm of overtreating low-risk disease, reflecting how patients weigh the benefits and harms associated with decision-making. The higher curve at any given threshold probability represents the optimal prediction that maximizes net benefit. The decision curve indicates that the combined predictive model used provides greater net benefit compared to other models. AUC: The area under the receiver operating characteristic curve; CT: Computed tomography.
- Citation: Xu YH, Lu P, Gao MC, Wang R, Li YY, Guo RQ, Zhang WS, Song JX. Nomogram based on multimodal magnetic resonance combined with B7-H3mRNA for preoperative lymph node prediction in esophagus cancer. World J Clin Oncol 2024; 15(3): 419-433
- URL: https://www.wjgnet.com/2218-4333/full/v15/i3/419.htm
- DOI: https://dx.doi.org/10.5306/wjco.v15.i3.419


