Copyright
©The Author(s) 2024.
World J Clin Oncol. Mar 24, 2024; 15(3): 391-410
Published online Mar 24, 2024. doi: 10.5306/wjco.v15.i3.391
Published online Mar 24, 2024. doi: 10.5306/wjco.v15.i3.391
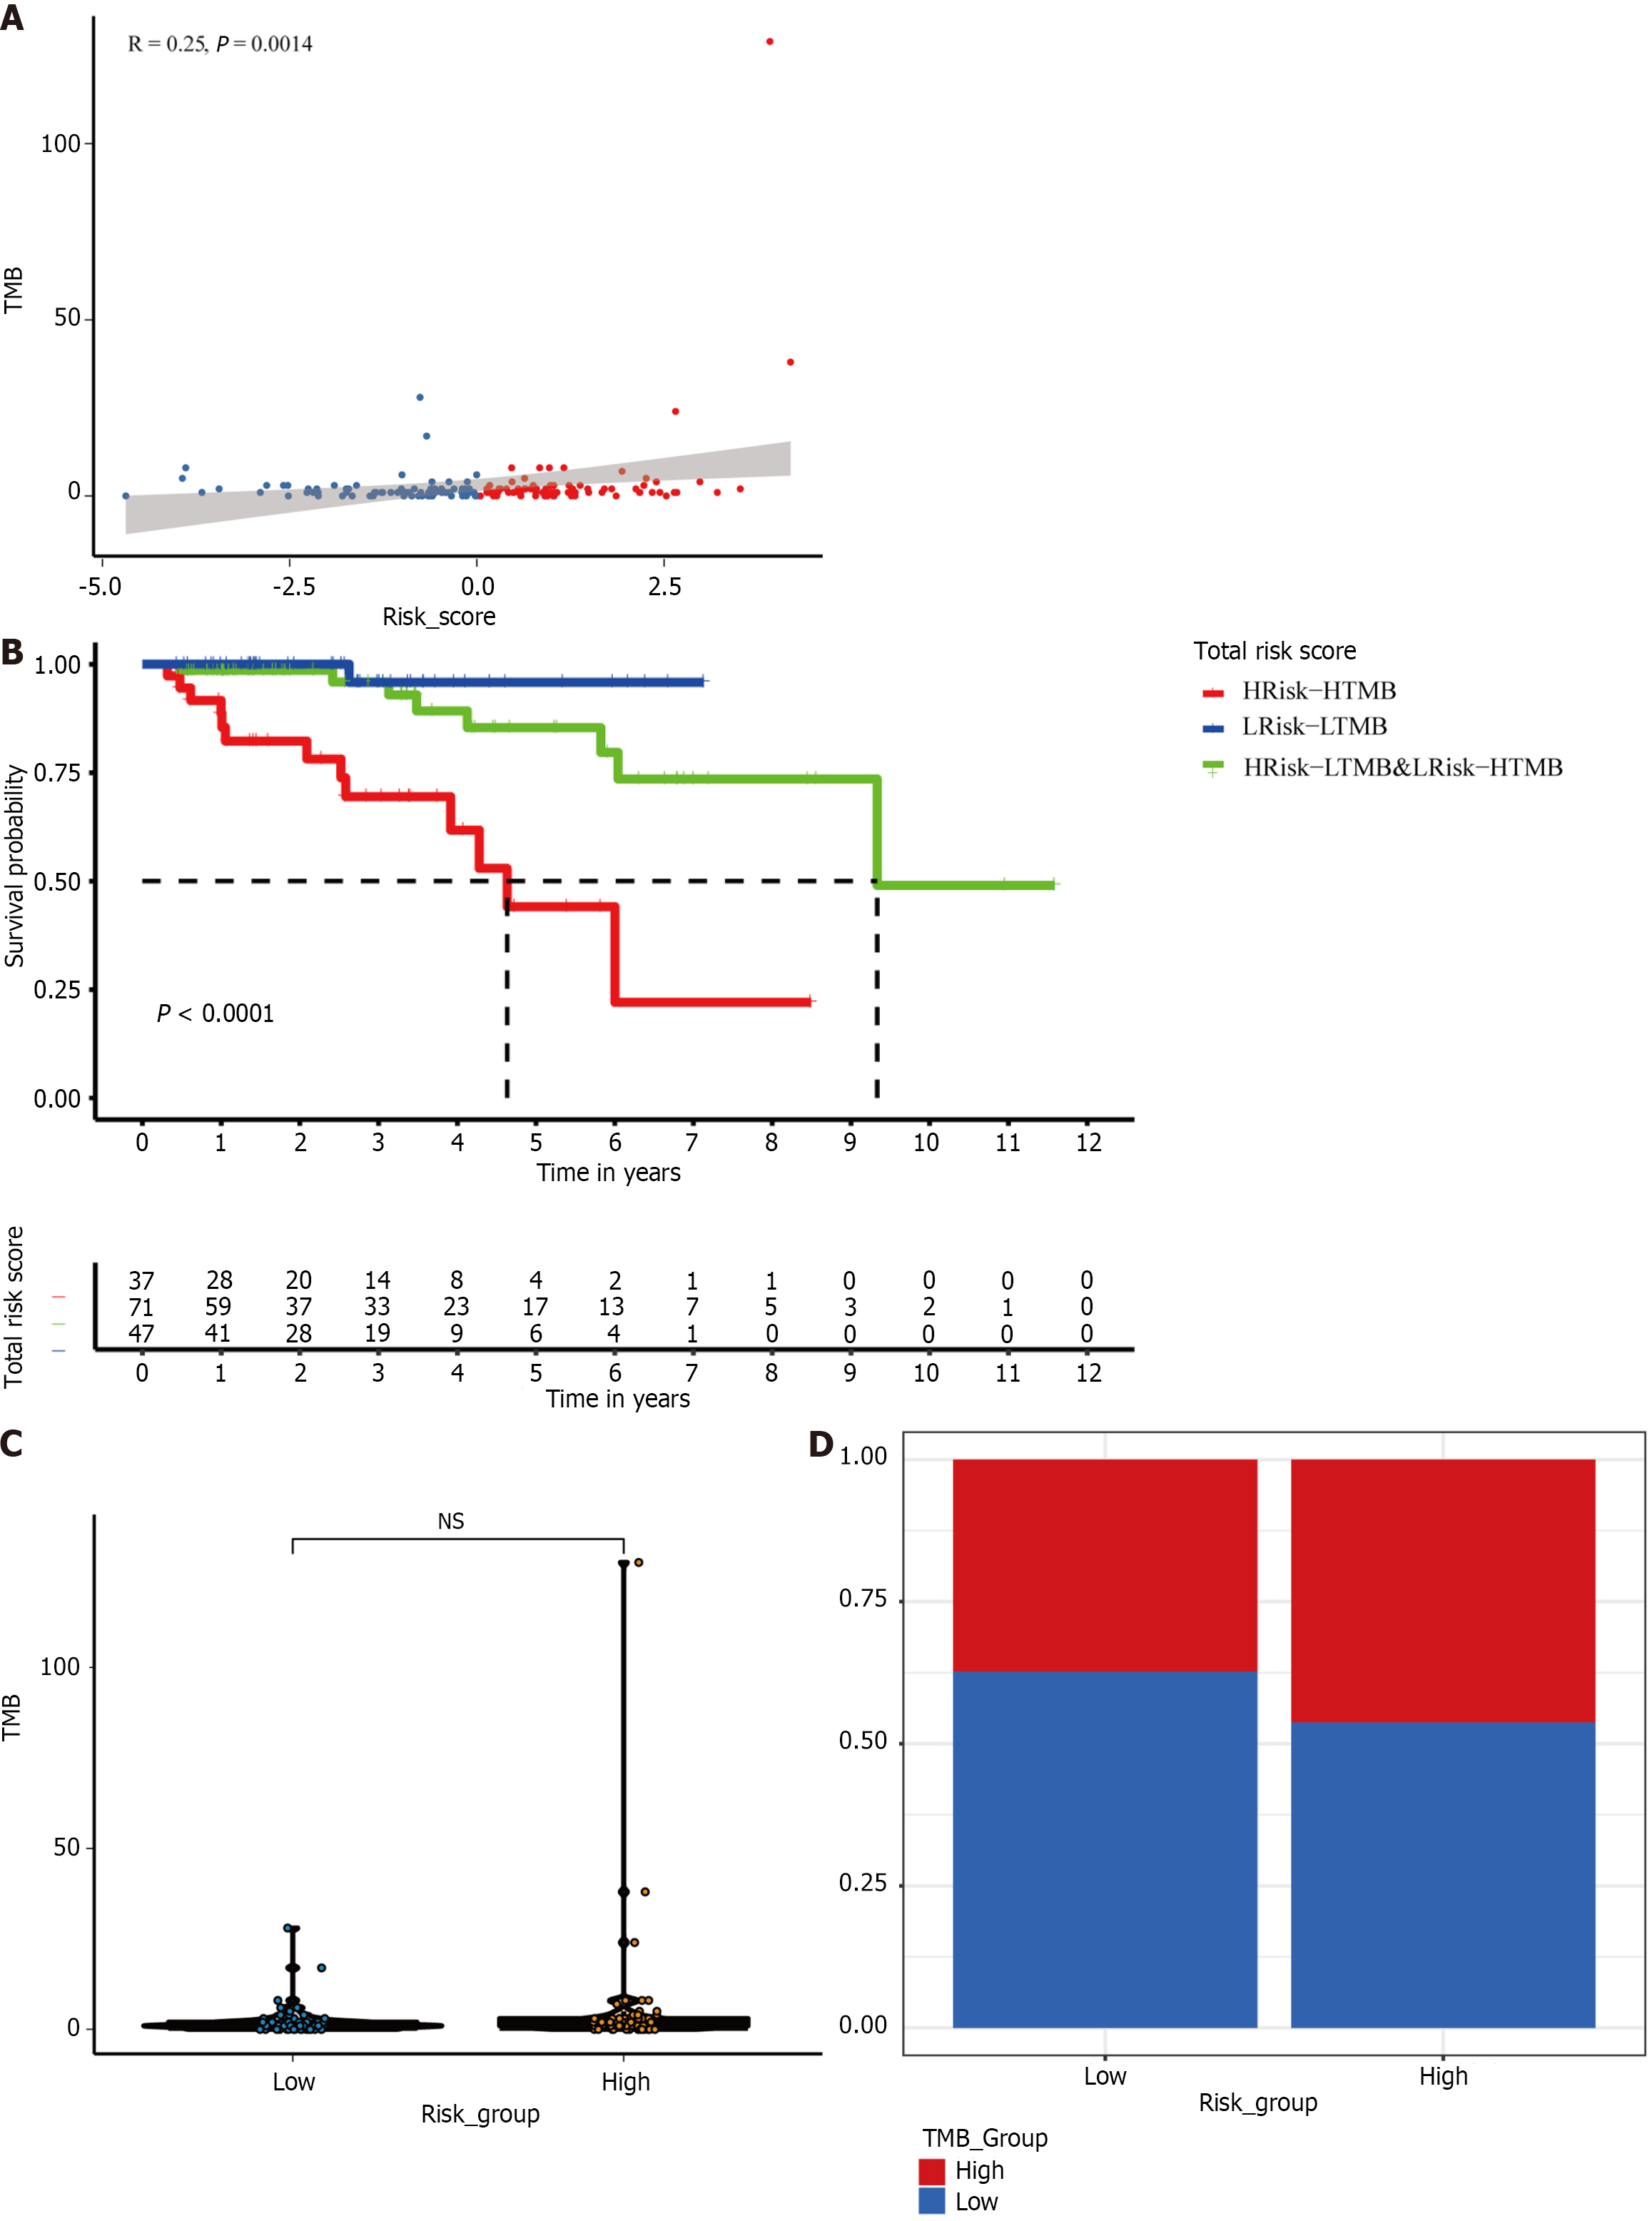
Figure 7 The mutation profile of different subgroups in the TCGA cohort.
A: Relationship between tumor mutation burden (TMB) and risk scores; B: Relationship between TMB groups and risk groups; C: TMB in low- and high-risk subgroups; D: Kaplan–Meier survival analysis of a new subset in a cohort of HER2+ breast cancer patients combined with the risk group and TMB. TMB: Tumor mutation burden; NS: Not significant; BC: Breast cancer.
- Citation: Shi JY, Che X, Wen R, Hou SJ, Xi YJ, Feng YQ, Wang LX, Liu SJ, Lv WH, Zhang YF. Ferroptosis biomarkers predict tumor mutation burden's impact on prognosis in HER2-positive breast cancer. World J Clin Oncol 2024; 15(3): 391-410
- URL: https://www.wjgnet.com/2218-4333/full/v15/i3/391.htm
- DOI: https://dx.doi.org/10.5306/wjco.v15.i3.391


