Copyright
©The Author(s) 2024.
World J Clin Oncol. Mar 24, 2024; 15(3): 391-410
Published online Mar 24, 2024. doi: 10.5306/wjco.v15.i3.391
Published online Mar 24, 2024. doi: 10.5306/wjco.v15.i3.391
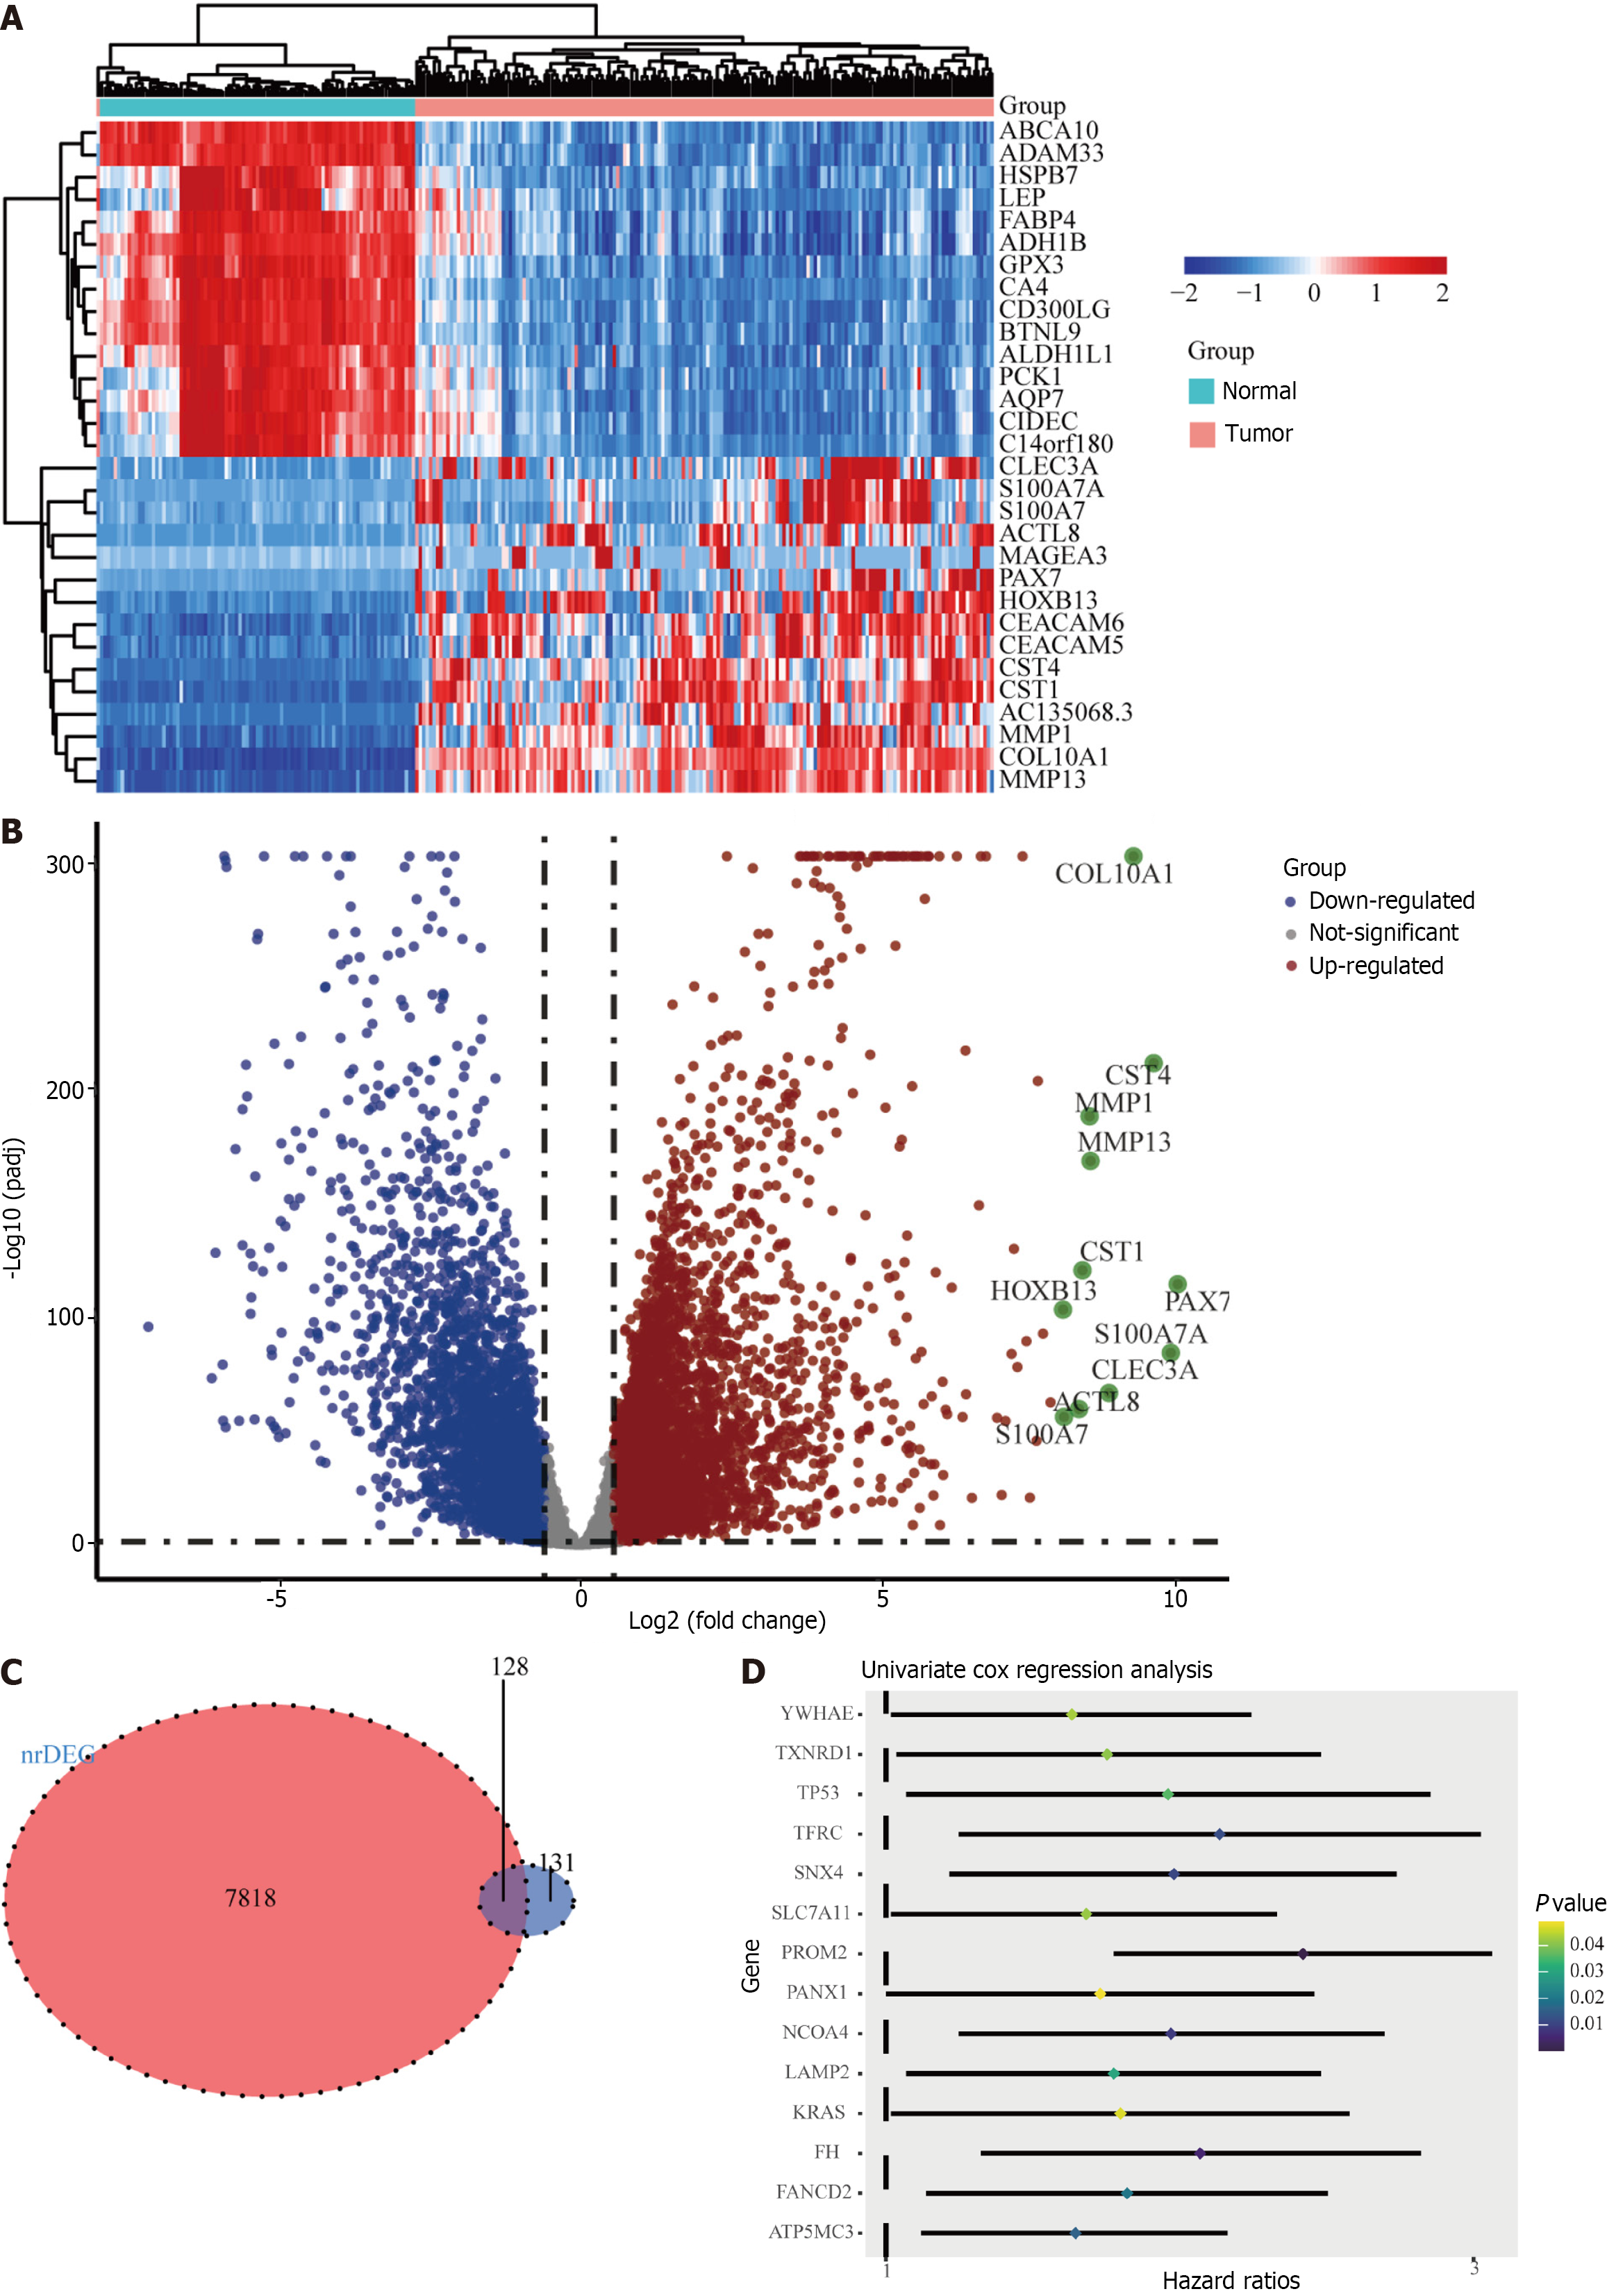
Figure 2 Identification of candidate genes associated with ferroptosis in the TCGA cohort.
A: Heatmap of candidate gene expression differences between tumor and normal tissues; B: Volcano map showing up-regulated and down-regulated genes; C: A Venn diagram to identify differentially expressed genes associated with ferroptosis between tumor and normal tissues; D: Forest plot showing univariate Cox regression analysis results of correlation between candidate gene expression and overall survival.
- Citation: Shi JY, Che X, Wen R, Hou SJ, Xi YJ, Feng YQ, Wang LX, Liu SJ, Lv WH, Zhang YF. Ferroptosis biomarkers predict tumor mutation burden's impact on prognosis in HER2-positive breast cancer. World J Clin Oncol 2024; 15(3): 391-410
- URL: https://www.wjgnet.com/2218-4333/full/v15/i3/391.htm
- DOI: https://dx.doi.org/10.5306/wjco.v15.i3.391


