Copyright
©The Author(s) 2024.
World J Clin Oncol. Feb 24, 2024; 15(2): 329-355
Published online Feb 24, 2024. doi: 10.5306/wjco.v15.i2.329
Published online Feb 24, 2024. doi: 10.5306/wjco.v15.i2.329
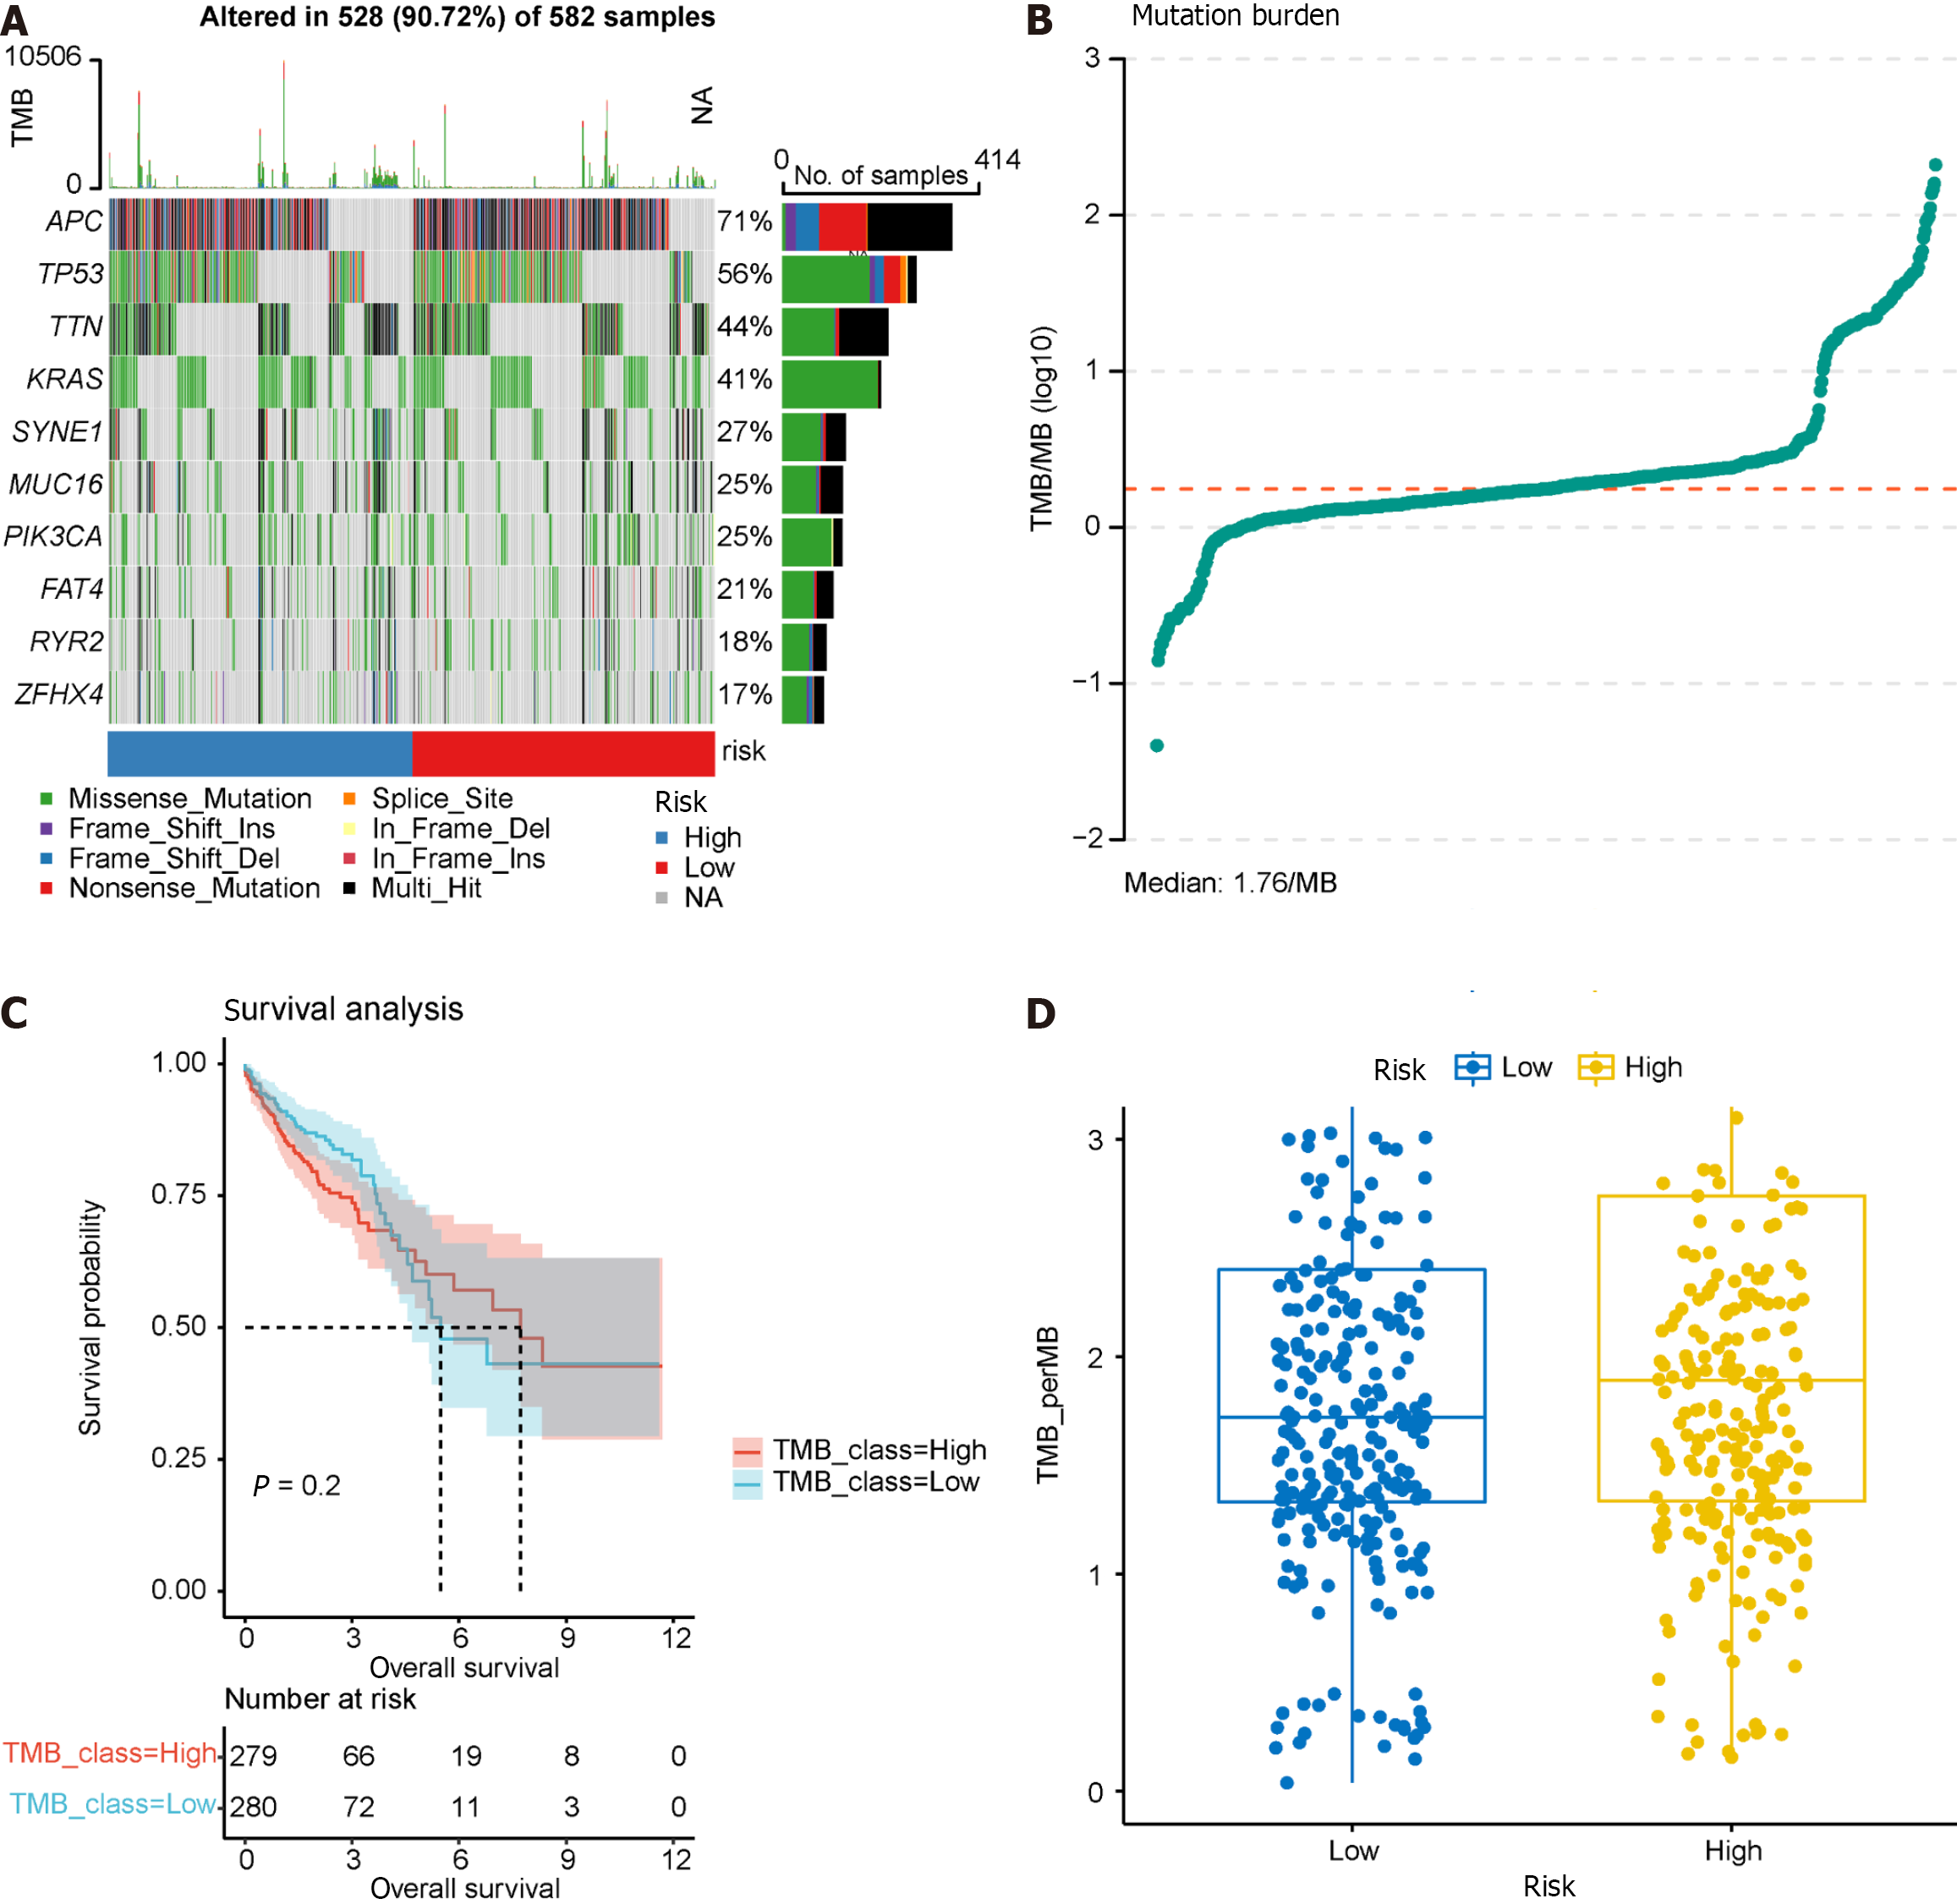
Figure 12 Tumor mutation burden analysis.
A: Waterfall plot illustrating the top 10 frequently mutated genes; B: Dot plot presenting the results of tumor mutation burden analysis, with the median tumor mutational burden at 1.78/Mb; C: Survival analysis of high and low tumor mutation burden groups; D: Comparison of tumor mutation burden between high and low prognostic risk groups.
- Citation: Zhu LH, Yang J, Zhang YF, Yan L, Lin WR, Liu WQ. Identification and validation of a pyroptosis-related prognostic model for colorectal cancer based on bulk and single-cell RNA sequencing data. World J Clin Oncol 2024; 15(2): 329-355
- URL: https://www.wjgnet.com/2218-4333/full/v15/i2/329.htm
- DOI: https://dx.doi.org/10.5306/wjco.v15.i2.329


