Copyright
©The Author(s) 2024.
World J Clin Oncol. Feb 24, 2024; 15(2): 329-355
Published online Feb 24, 2024. doi: 10.5306/wjco.v15.i2.329
Published online Feb 24, 2024. doi: 10.5306/wjco.v15.i2.329
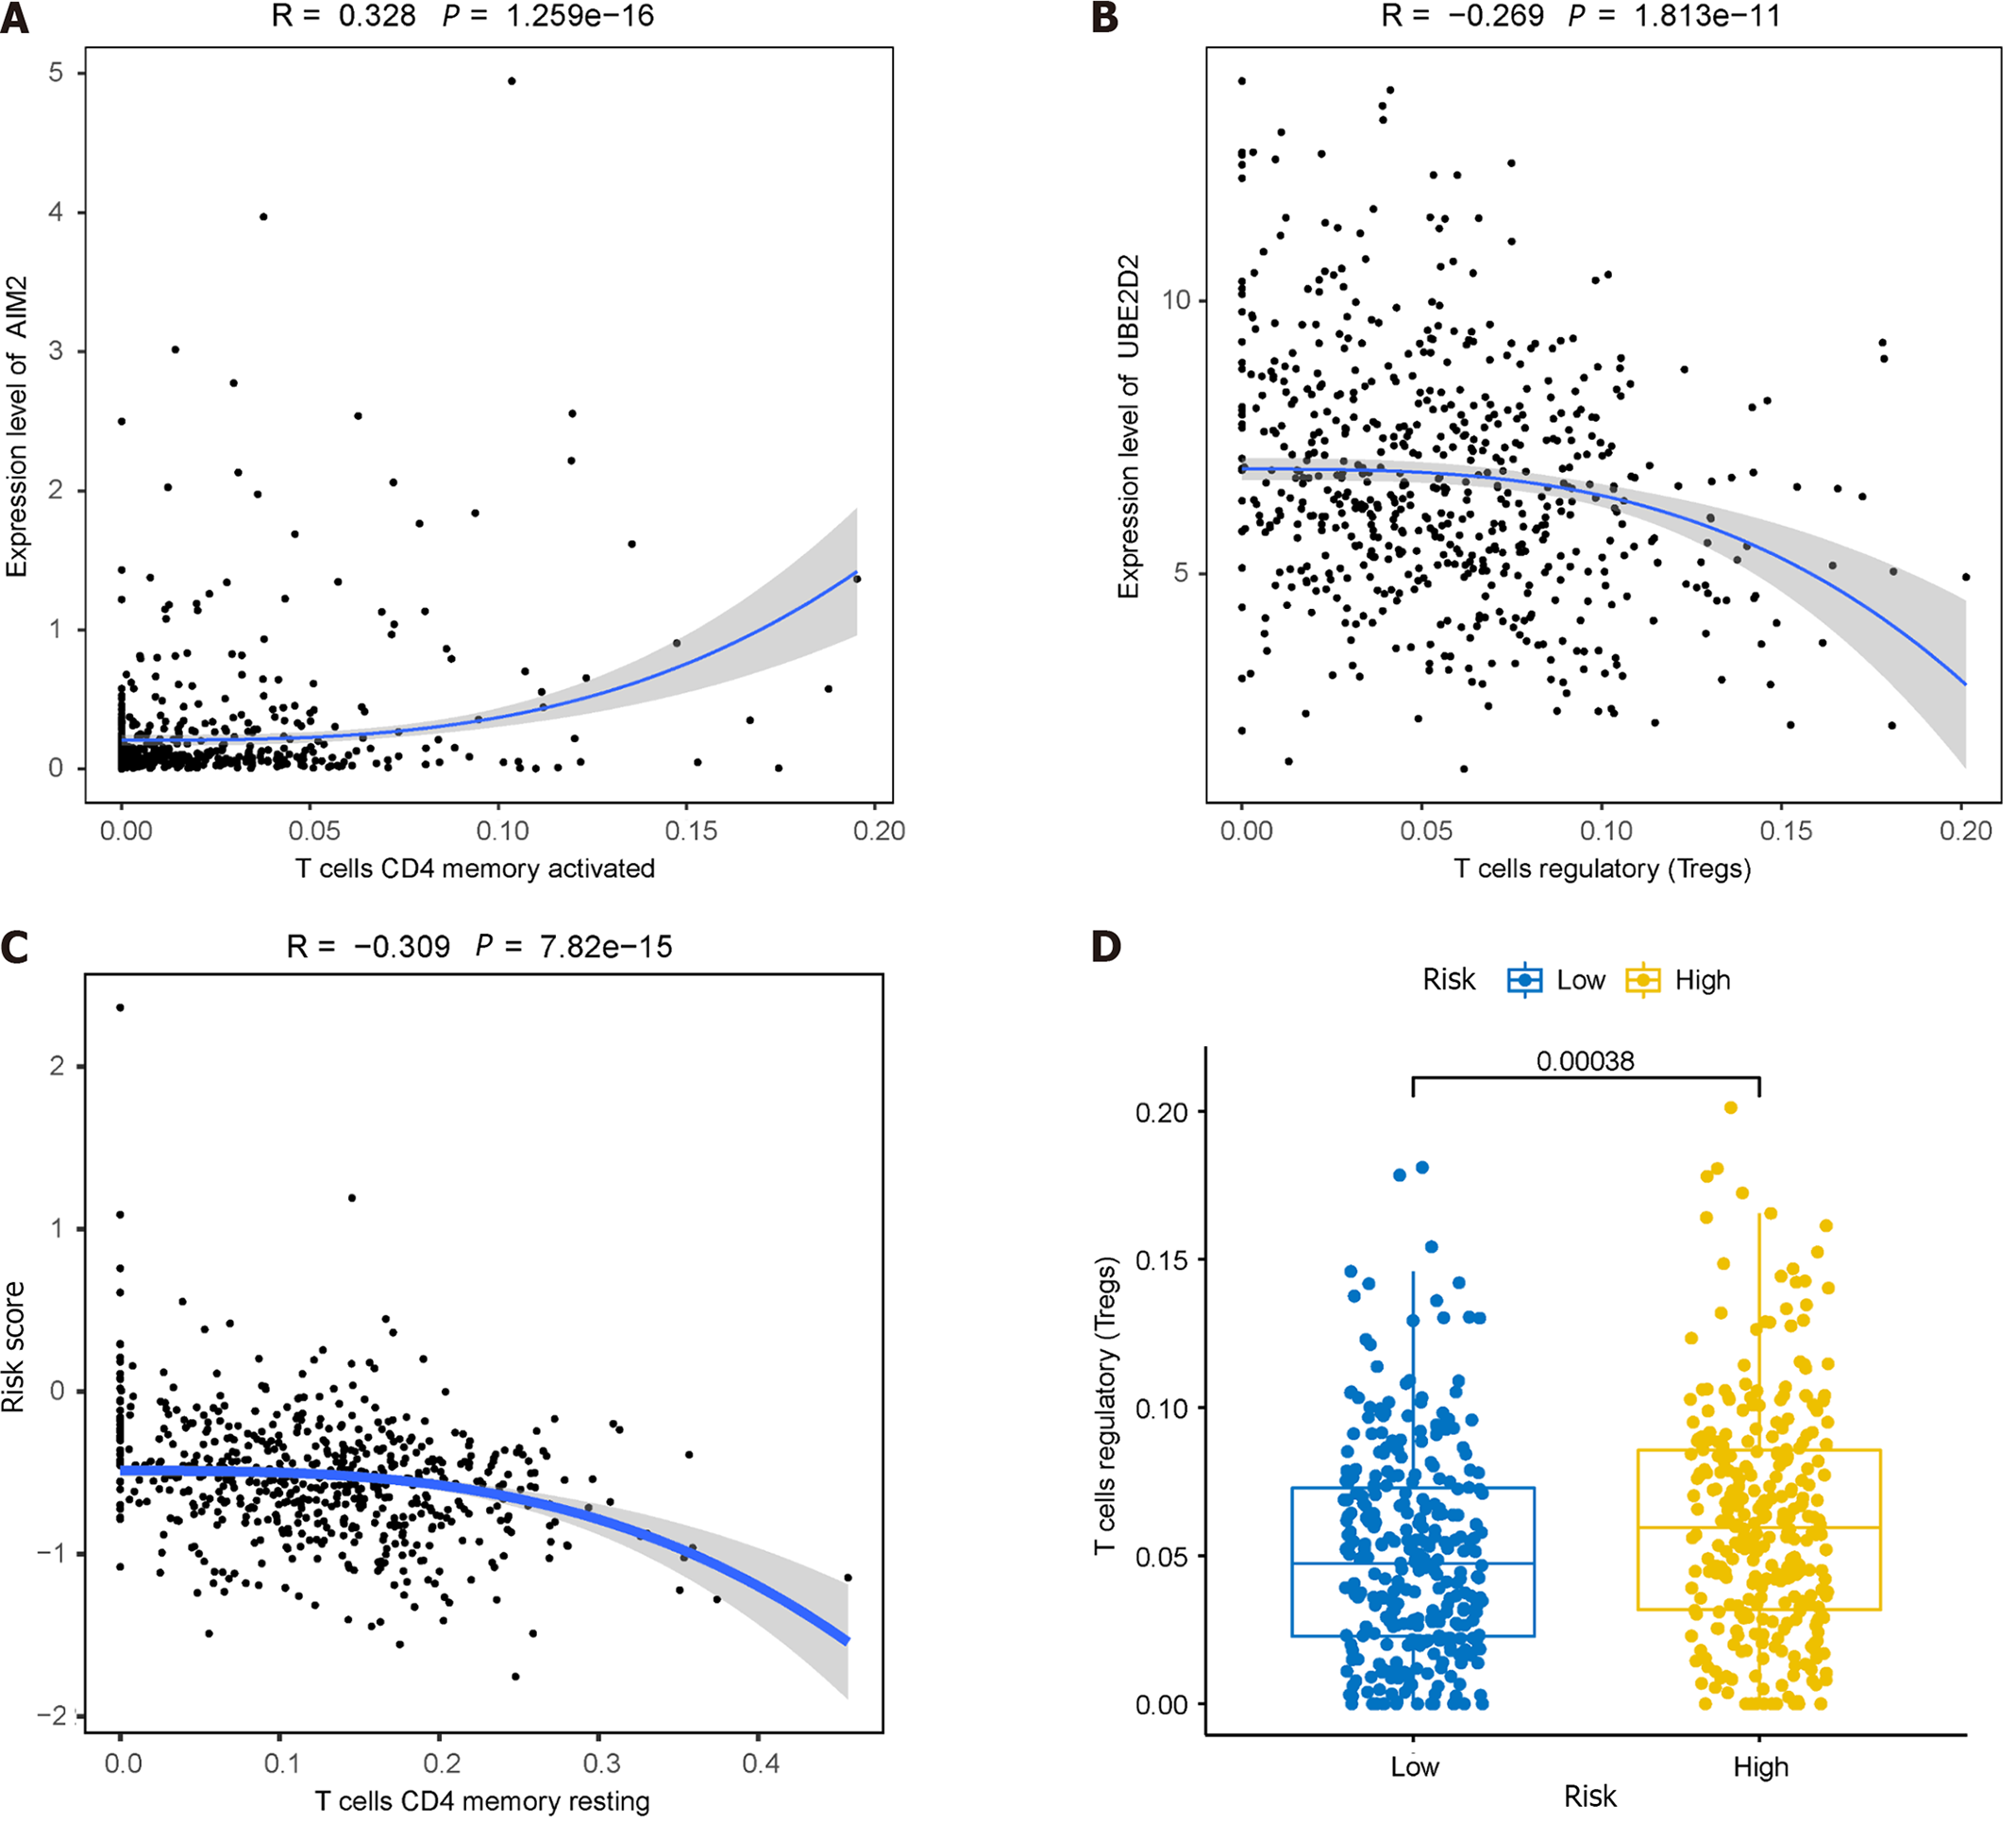
Figure 11 Immunoassays of prognostic models.
A: Positive correlation between AIM2 gene expression and the abundance of activated memory CD4+ T cells; B: Inverse correlation between UBE2D2 gene expression and the cellular abundance of regulatory T cells (Tregs); C: Correlation of immune cell infiltration with high and low-risk groups; D: Significant differences observed in the abundance of Tregs between the high and low-risk groups.
- Citation: Zhu LH, Yang J, Zhang YF, Yan L, Lin WR, Liu WQ. Identification and validation of a pyroptosis-related prognostic model for colorectal cancer based on bulk and single-cell RNA sequencing data. World J Clin Oncol 2024; 15(2): 329-355
- URL: https://www.wjgnet.com/2218-4333/full/v15/i2/329.htm
- DOI: https://dx.doi.org/10.5306/wjco.v15.i2.329


