Copyright
©The Author(s) 2024.
World J Clin Oncol. Feb 24, 2024; 15(2): 329-355
Published online Feb 24, 2024. doi: 10.5306/wjco.v15.i2.329
Published online Feb 24, 2024. doi: 10.5306/wjco.v15.i2.329
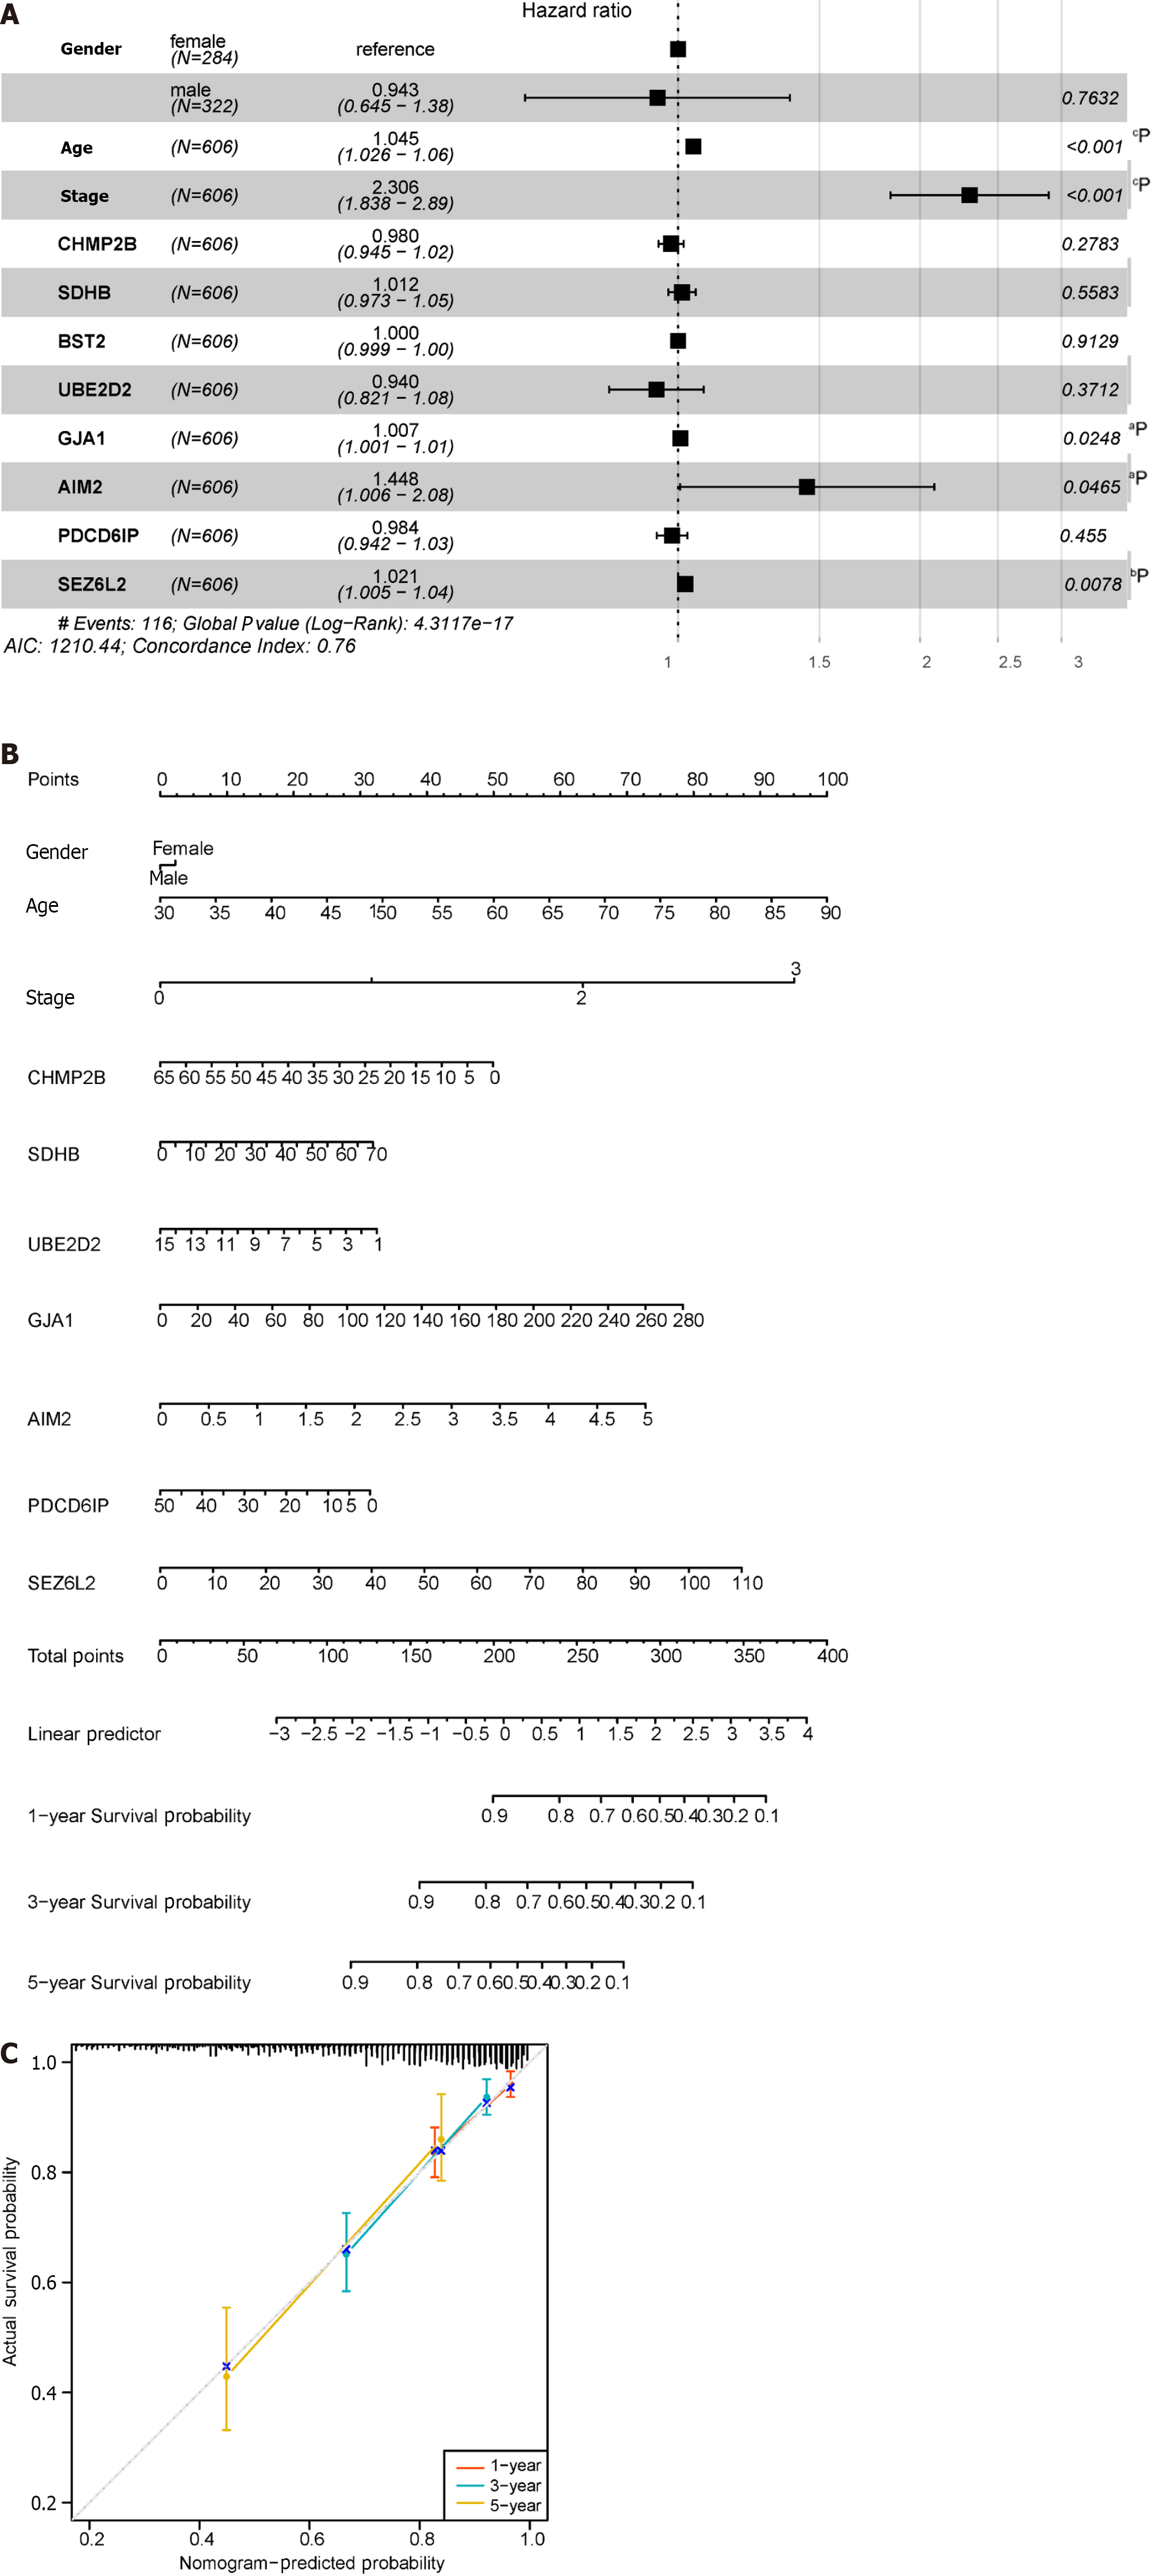
Figure 10 Construction of the nomogram.
A: Forest plot illustrating the influence of clinicopathological features; B: Nomogram integrating multi-omics data with clinicopathological features; C: Calibration curve of the overall survival nomogram, where the diagonal dashed line represents the ideal nomogram. aP < 0.05; bP < 0.01; cP < 0.001; dP < 0.0001.
- Citation: Zhu LH, Yang J, Zhang YF, Yan L, Lin WR, Liu WQ. Identification and validation of a pyroptosis-related prognostic model for colorectal cancer based on bulk and single-cell RNA sequencing data. World J Clin Oncol 2024; 15(2): 329-355
- URL: https://www.wjgnet.com/2218-4333/full/v15/i2/329.htm
- DOI: https://dx.doi.org/10.5306/wjco.v15.i2.329


