Copyright
©The Author(s) 2024.
World J Clin Oncol. Feb 24, 2024; 15(2): 329-355
Published online Feb 24, 2024. doi: 10.5306/wjco.v15.i2.329
Published online Feb 24, 2024. doi: 10.5306/wjco.v15.i2.329
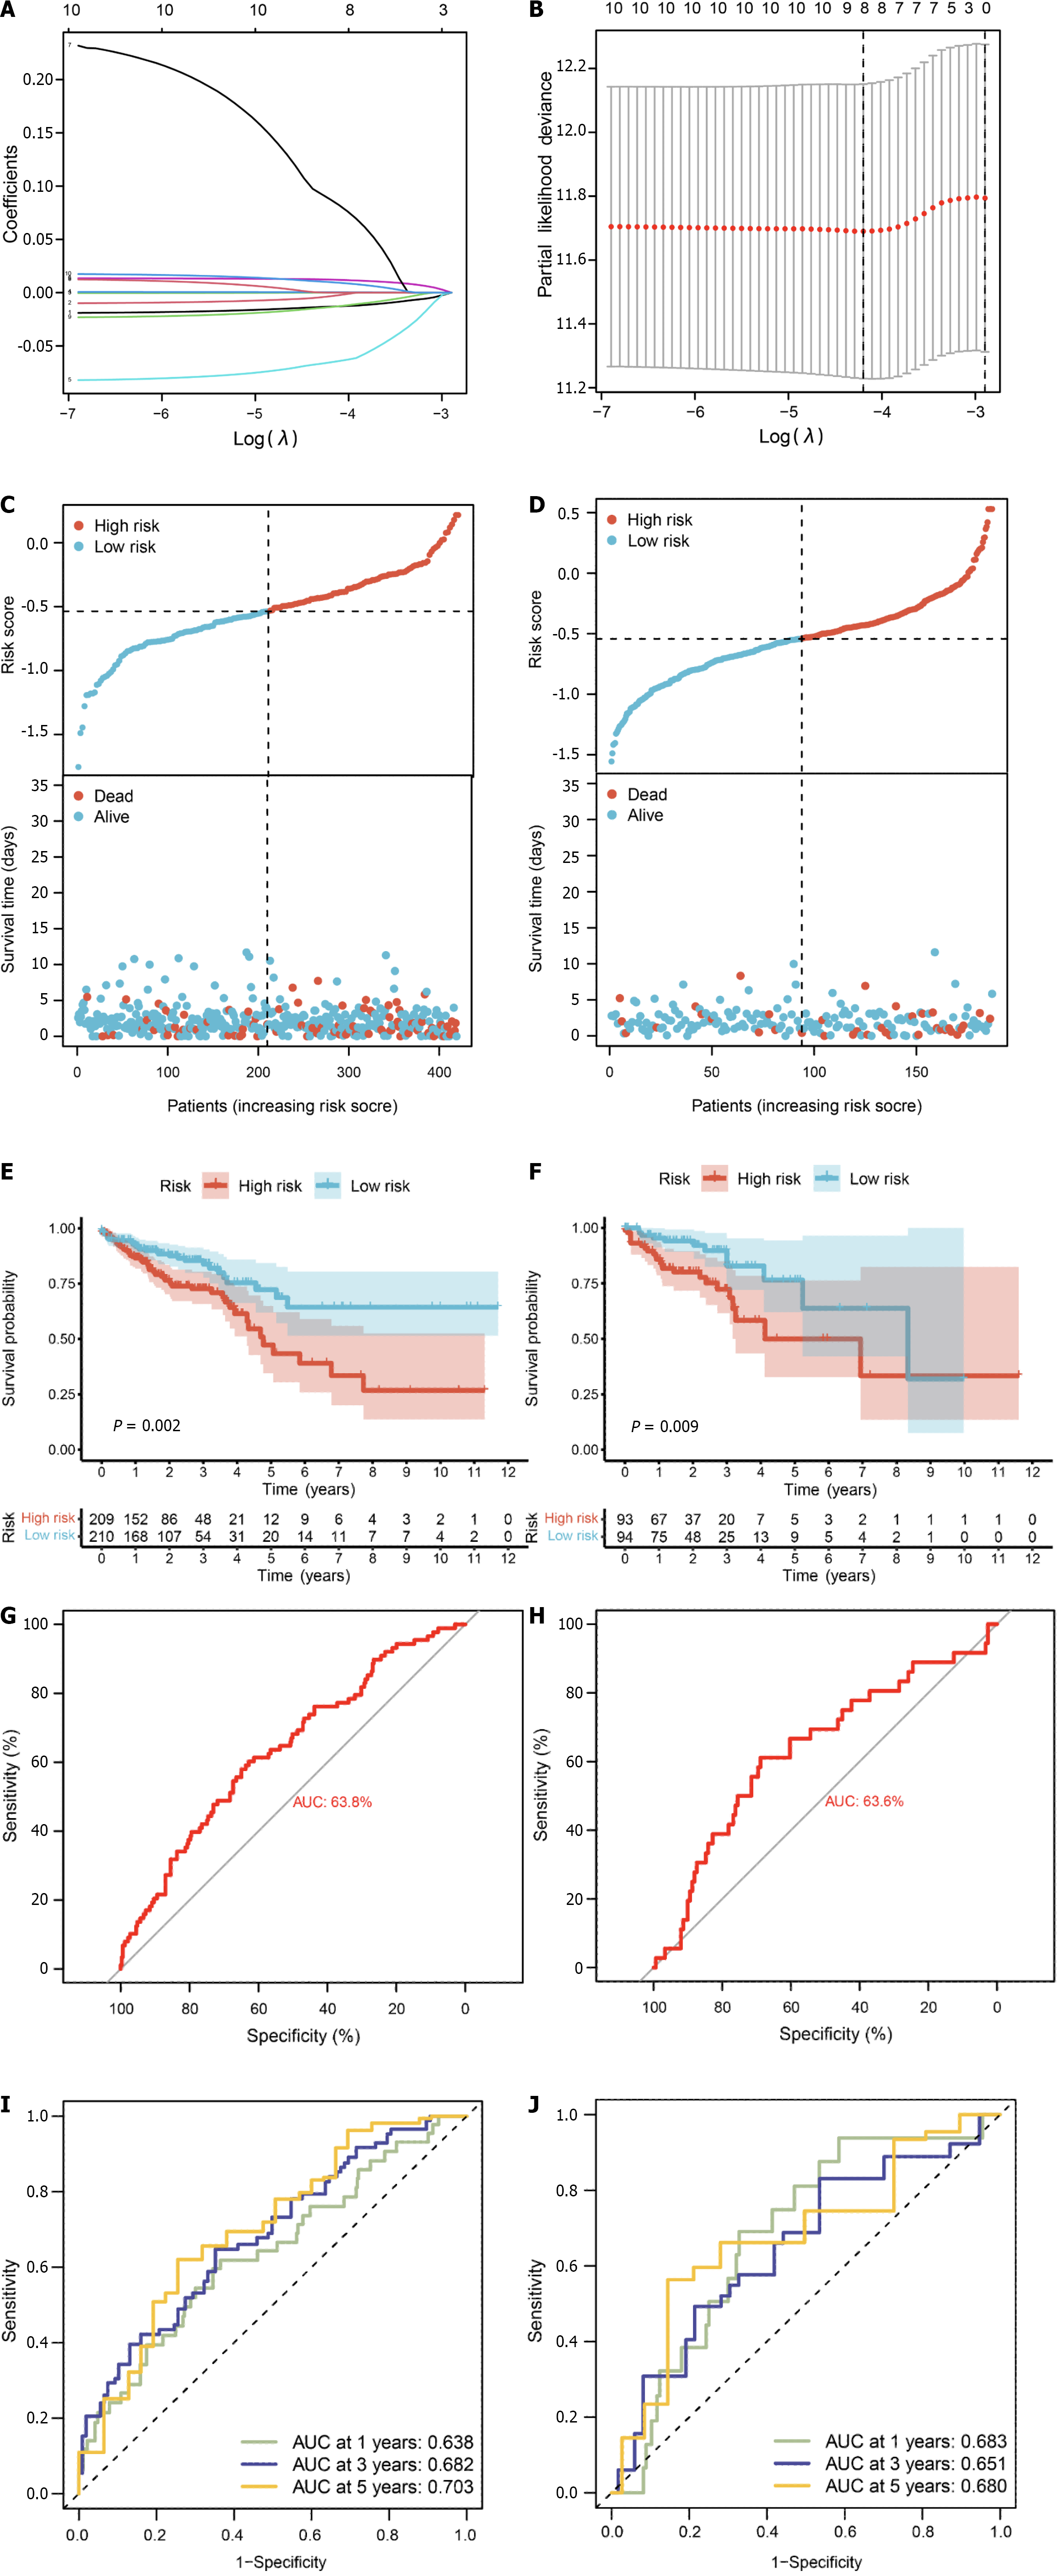
Figure 9 Prognostic model based on pyroptosis-related genes.
A: Construction of a fitting model using LASSO regression, illustrating changes in the lambda value of 10 pyroptosis-related genes significantly associated with prognosis. The X-axis represents the Log λ value, and the Y-axis represents the coefficient; B: Cross-validation analysis determining the optimal lambda value for the fitted model. The X-axis represents the logized lambda value, the Y-axis represents the error of the model, and the dashed line on the left signifies the lambda value minimizing the error and the number of screened features; C: Risk map of the training set, where red dots represent high-risk patients, and light blue represents low-risk patients; D: Risk map of the test set; E: Survival curve of the training set (P = 0.002), where a smaller P value indicates higher accuracy; F: Survival curve of the test set (P = 0.009); G: Receiver operating characteristic (ROC) curve of the training set [area under the curve (AUC) = 63.8%], where a higher AUC signifies greater accuracy; H: ROC curve for the test set (AUC = 63.6%); I: ROC curve for 1-, 3-, and 5-year calculated from the risk score in the training set; J: ROC curve for 1-, 3-, and 5-year calculated from the risk score in the test set.
- Citation: Zhu LH, Yang J, Zhang YF, Yan L, Lin WR, Liu WQ. Identification and validation of a pyroptosis-related prognostic model for colorectal cancer based on bulk and single-cell RNA sequencing data. World J Clin Oncol 2024; 15(2): 329-355
- URL: https://www.wjgnet.com/2218-4333/full/v15/i2/329.htm
- DOI: https://dx.doi.org/10.5306/wjco.v15.i2.329


