Copyright
©The Author(s) 2024.
World J Clin Oncol. Feb 24, 2024; 15(2): 329-355
Published online Feb 24, 2024. doi: 10.5306/wjco.v15.i2.329
Published online Feb 24, 2024. doi: 10.5306/wjco.v15.i2.329
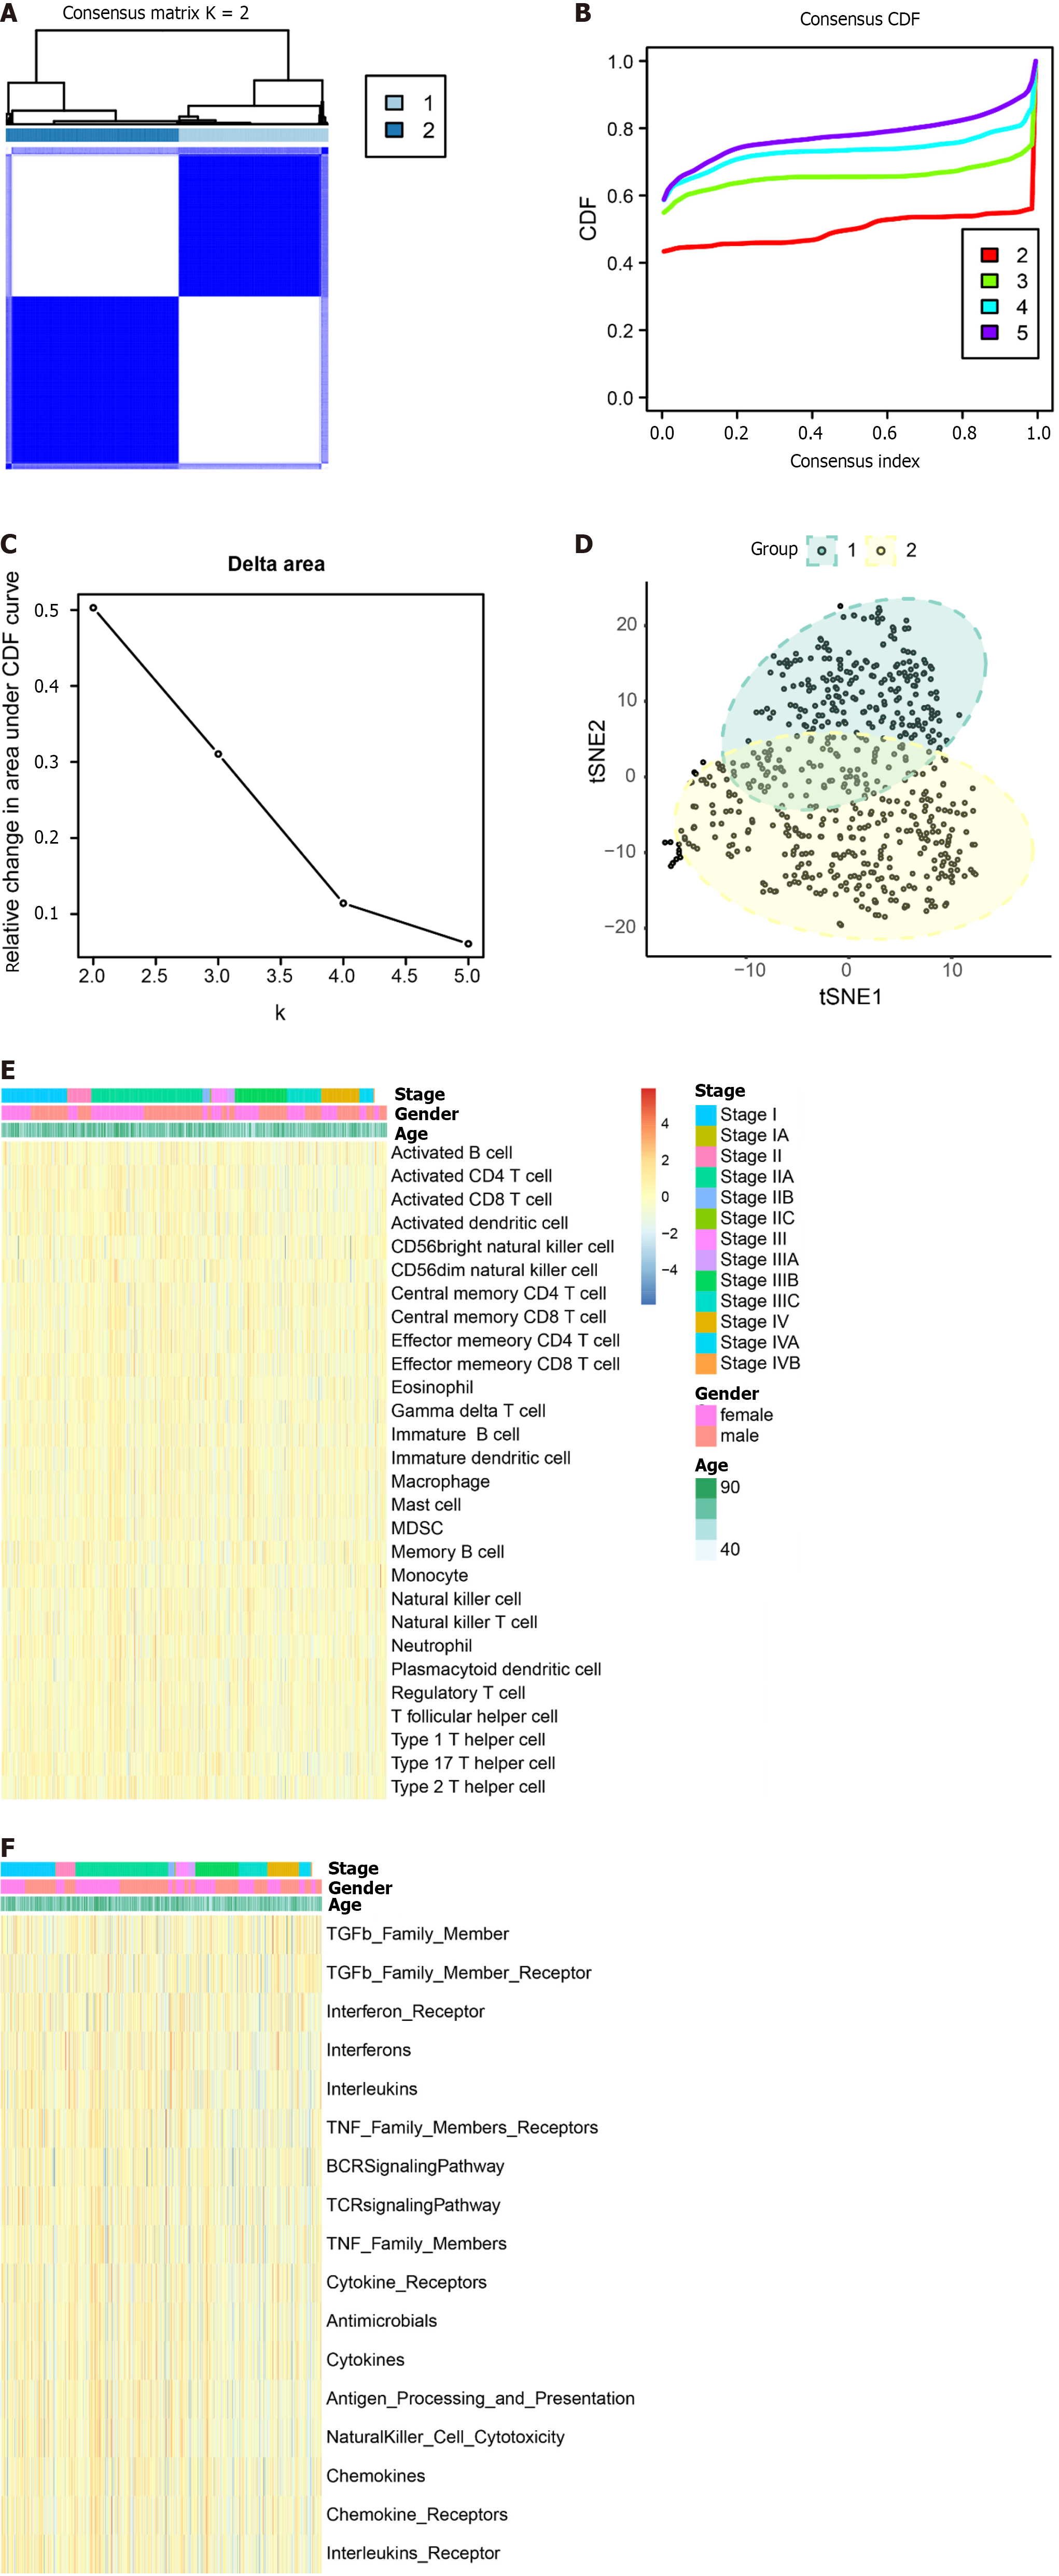
Figure 8 Exploring typing by consensus clustering and single-sample gene set enrichment analysis.
A: Heatmap depicting the concordance clustering matrix, with values ranging from 0 (impossible to cluster together) to 1 (always clustered together). Shades of white to dark blue represent the scale of concordance; B and C: Consistent CDF plot and Delta Area Plot; D: Cluster analysis using tSNE algorithm; E: Single-sample gene set enrichment analysis (ssGSEA) of immune cells. Legend includes tumor stage, gender, and age; F: ssGSEA of immune function. Legend includes tumor stage, gender, and age.
- Citation: Zhu LH, Yang J, Zhang YF, Yan L, Lin WR, Liu WQ. Identification and validation of a pyroptosis-related prognostic model for colorectal cancer based on bulk and single-cell RNA sequencing data. World J Clin Oncol 2024; 15(2): 329-355
- URL: https://www.wjgnet.com/2218-4333/full/v15/i2/329.htm
- DOI: https://dx.doi.org/10.5306/wjco.v15.i2.329


