Copyright
©The Author(s) 2024.
World J Clin Oncol. Feb 24, 2024; 15(2): 329-355
Published online Feb 24, 2024. doi: 10.5306/wjco.v15.i2.329
Published online Feb 24, 2024. doi: 10.5306/wjco.v15.i2.329
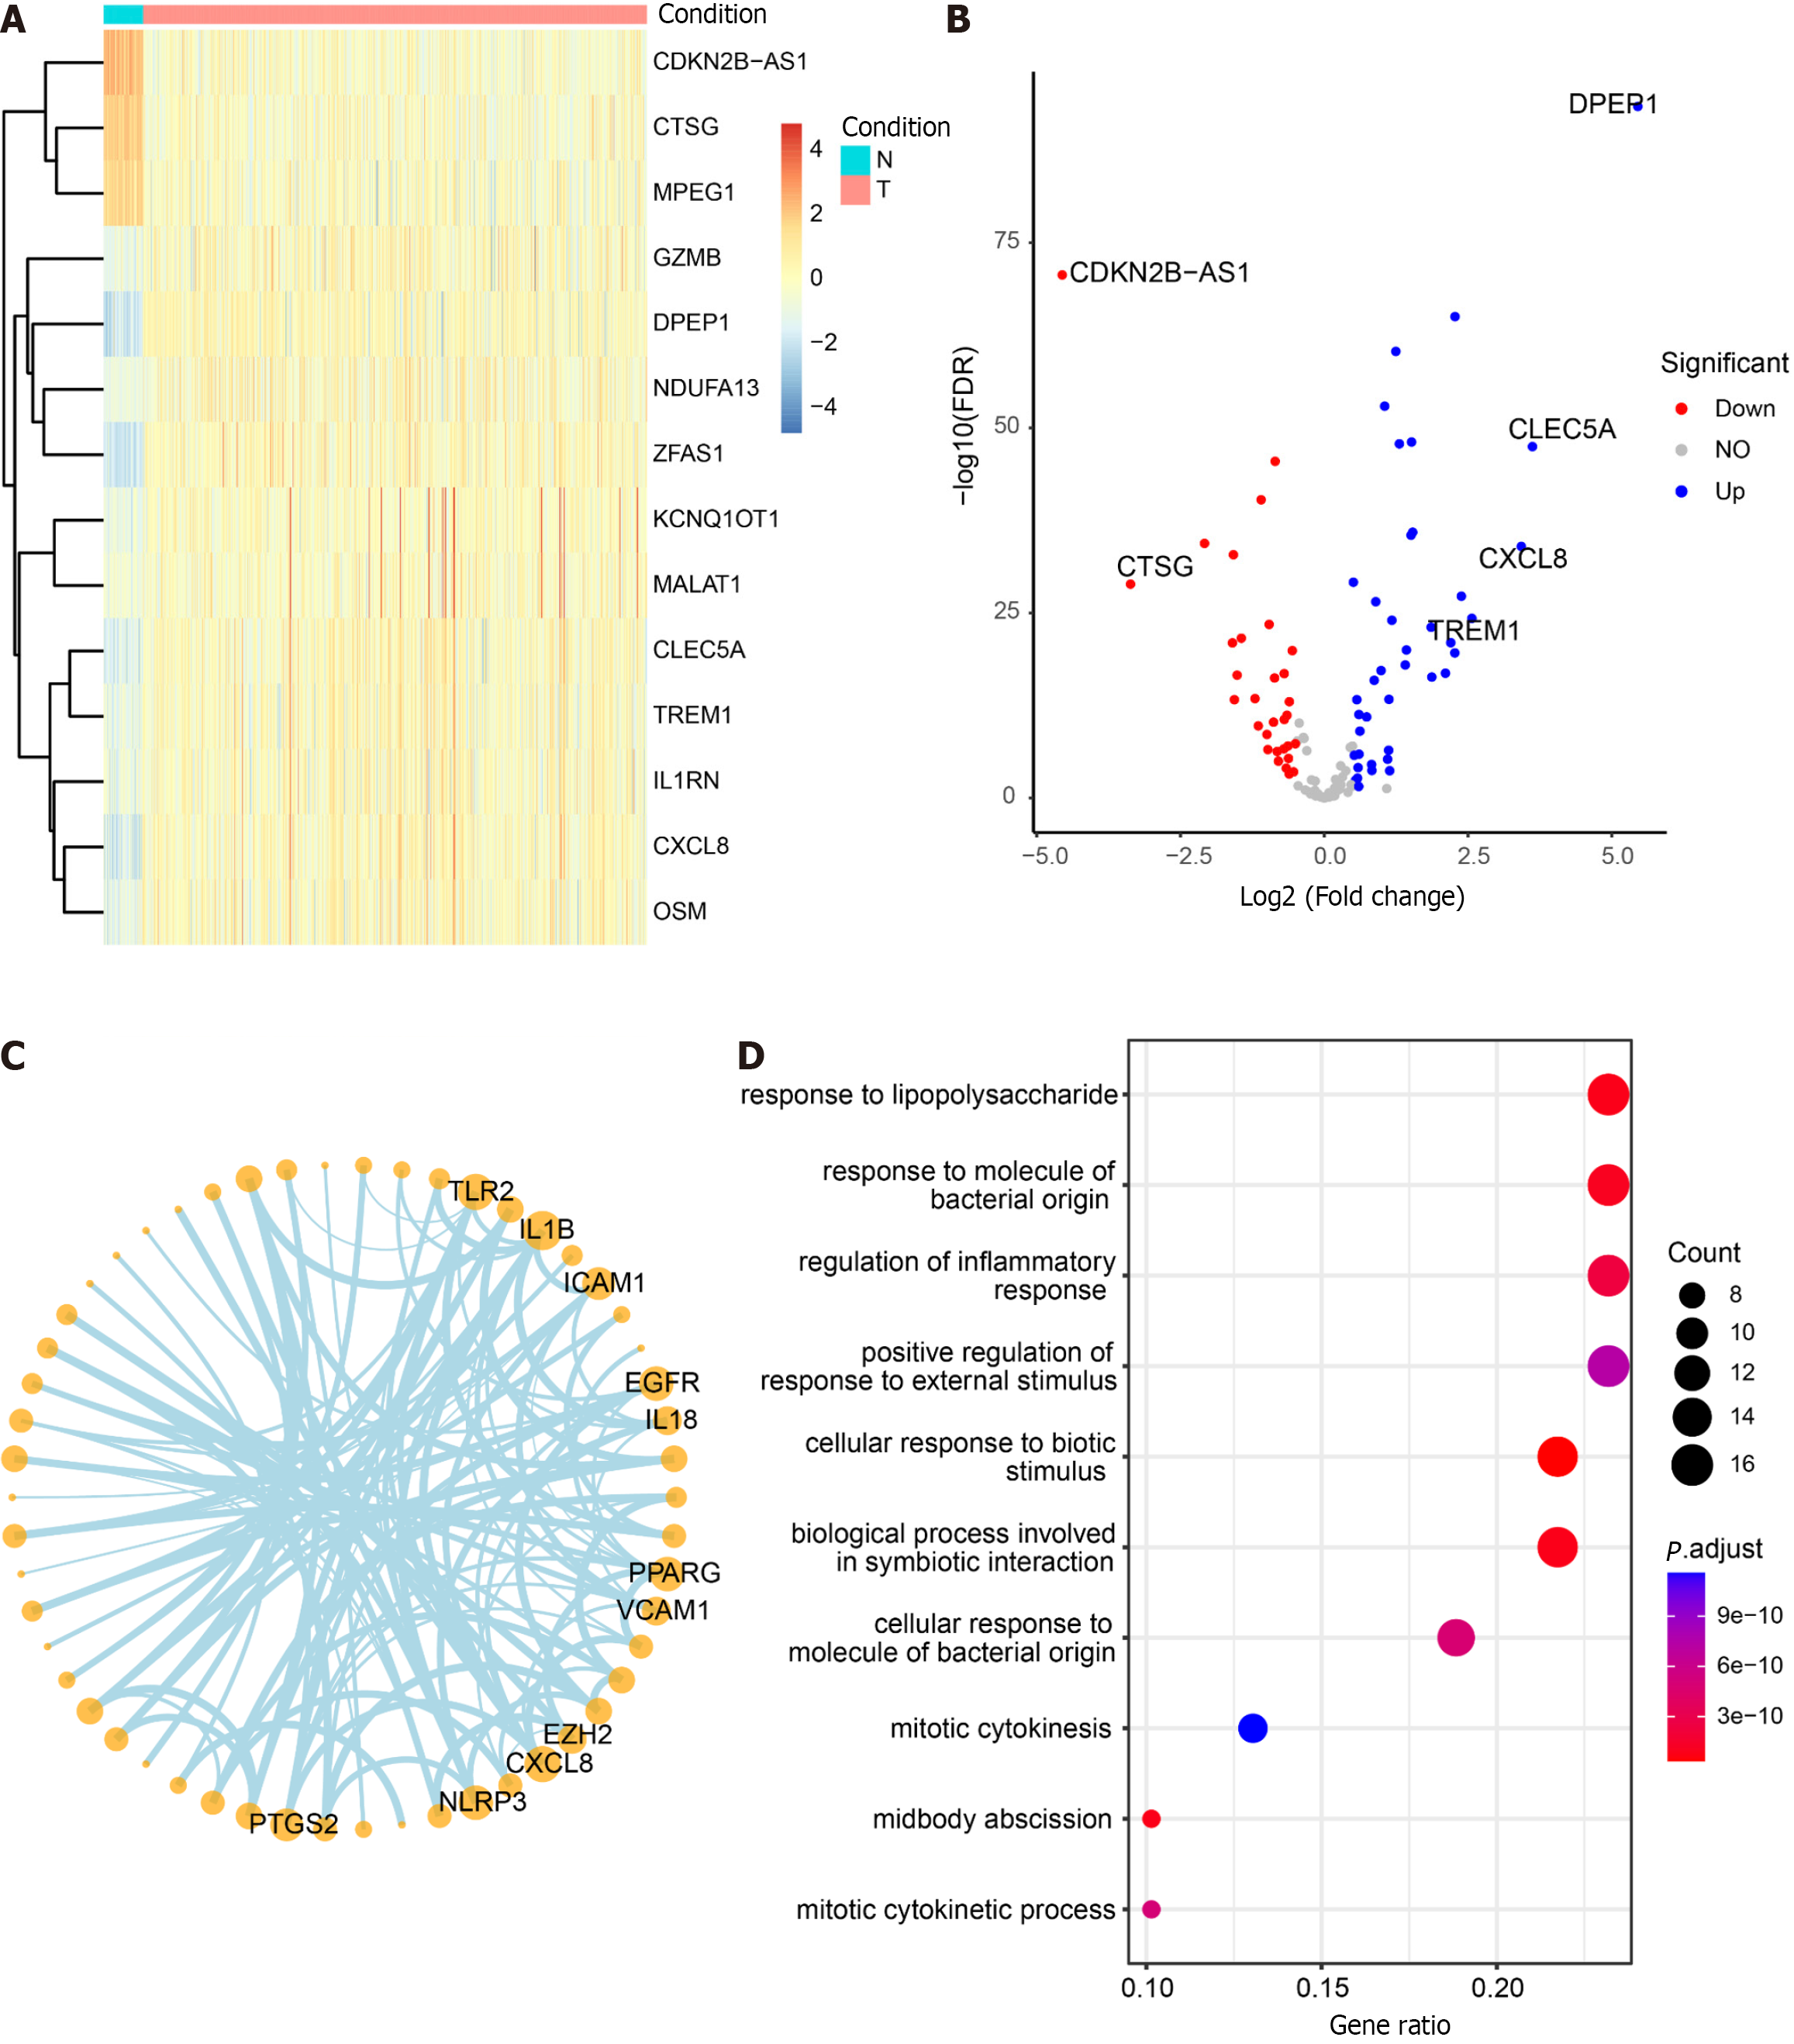
Figure 7 Differential analysis, correlation, and enrichment analysis of pyroptosis-related genes.
A: Heatmap illustrating the expression profiles of the top 14 differential pyroptosis-related genes. Colors range from blue to red, indicating a gradual increase in expression levels. The color bar above distinguishes (non-colorectal cancer) non-CRC tissues (N) in blue and CRC tissues (T) in red; B: Volcano plot depicting the results of CRC vs non-CRC differential analysis; C: Correlation network diagram highlighting highly connected pyroptotic genes; D: Results of Gene Ontology enrichment analysis for 125 pyroptosis-related genes. The bubble plot displays the top 10 most significant enriched functions. The X-axis represents Gene Ratio, and the color of the bubbles ranges from blue to red, with red indicating more significant enrichment. The Y-axis denotes the name of the pathway.
- Citation: Zhu LH, Yang J, Zhang YF, Yan L, Lin WR, Liu WQ. Identification and validation of a pyroptosis-related prognostic model for colorectal cancer based on bulk and single-cell RNA sequencing data. World J Clin Oncol 2024; 15(2): 329-355
- URL: https://www.wjgnet.com/2218-4333/full/v15/i2/329.htm
- DOI: https://dx.doi.org/10.5306/wjco.v15.i2.329


