Copyright
©The Author(s) 2024.
World J Clin Oncol. Feb 24, 2024; 15(2): 329-355
Published online Feb 24, 2024. doi: 10.5306/wjco.v15.i2.329
Published online Feb 24, 2024. doi: 10.5306/wjco.v15.i2.329
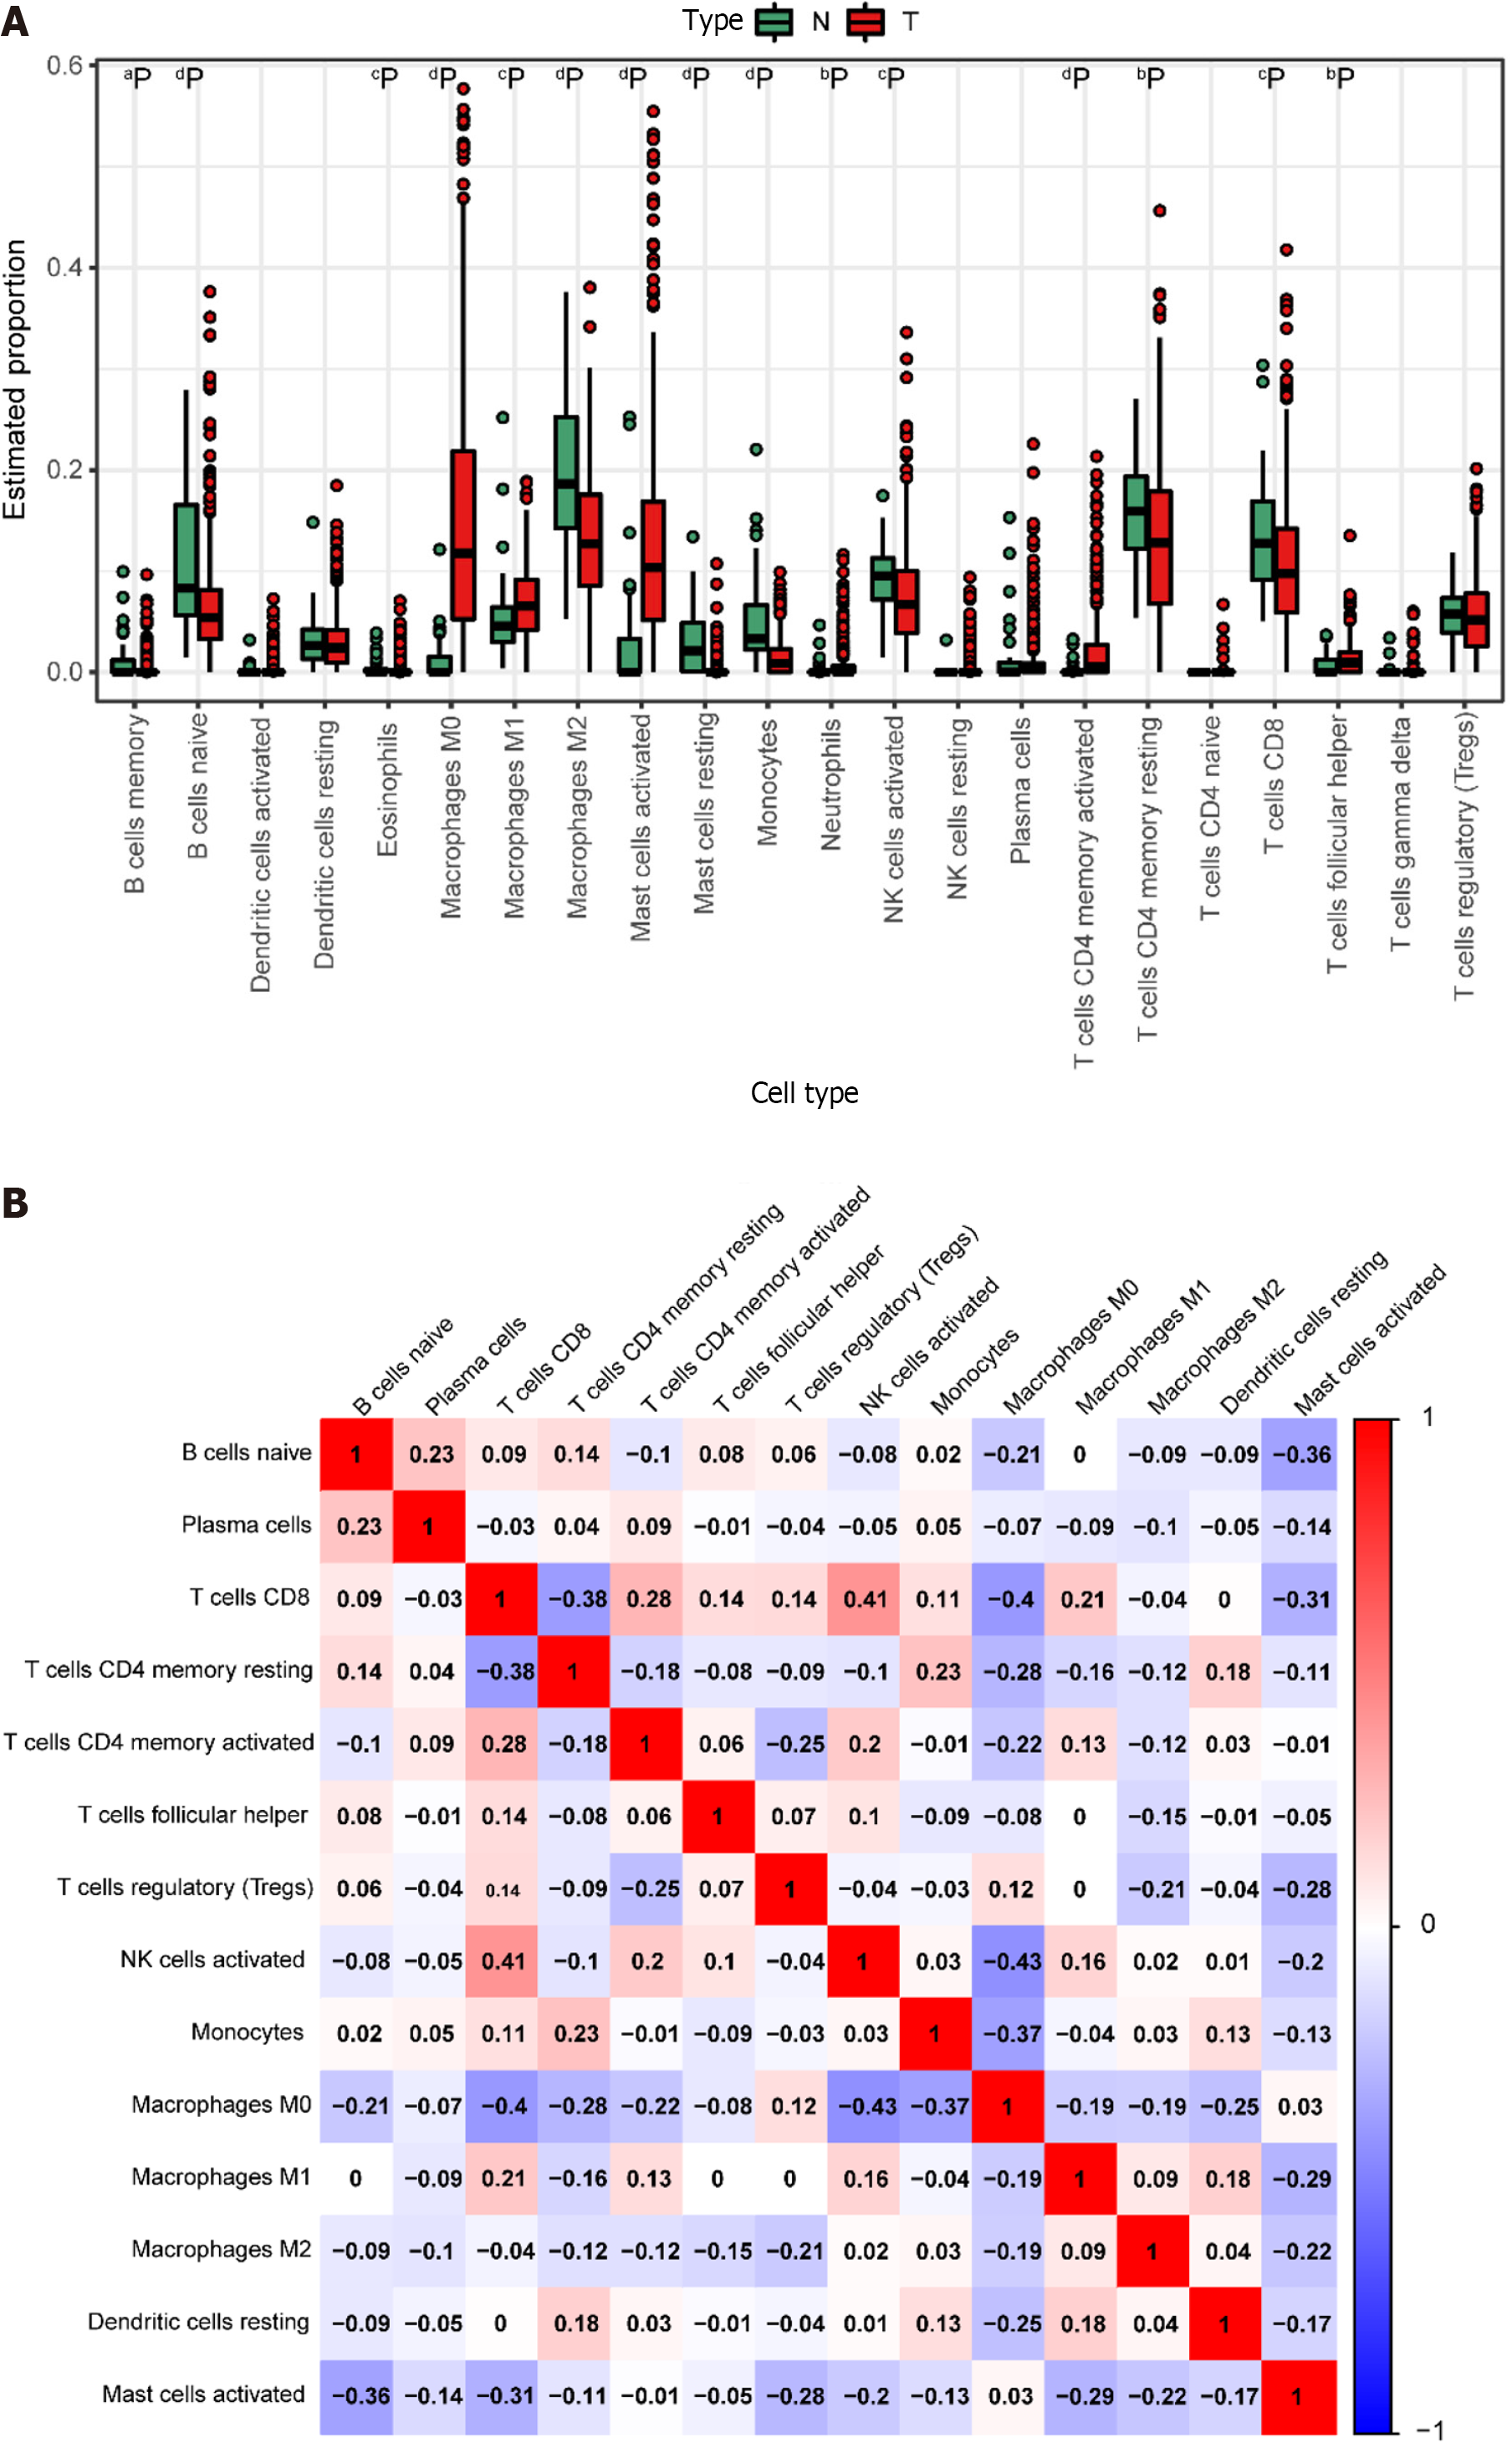
Figure 4 Immune cell prediction from The Cancer Genome Atlas Dataset.
A: Disparities in different immune cell types between tumor and normal samples in the The Cancer Genome Atlas (TCGA) dataset. Normal samples are denoted in green, and tumor samples are denoted in red. Significance levels are indicated as follows: aP < 0.05; bP < 0.01; cP < 0.001; dP < 0.0001; B: Heatmap illustrating the correlation among highly expressing immune cells in the TCGA dataset. The color scale of blue, white, and red denotes the strength of correlation, with darker colors signifying stronger correlations. Red indicates a positive correlation, while blue indicates a negative correlation.
- Citation: Zhu LH, Yang J, Zhang YF, Yan L, Lin WR, Liu WQ. Identification and validation of a pyroptosis-related prognostic model for colorectal cancer based on bulk and single-cell RNA sequencing data. World J Clin Oncol 2024; 15(2): 329-355
- URL: https://www.wjgnet.com/2218-4333/full/v15/i2/329.htm
- DOI: https://dx.doi.org/10.5306/wjco.v15.i2.329


