Copyright
©The Author(s) 2024.
World J Clin Oncol. Feb 24, 2024; 15(2): 329-355
Published online Feb 24, 2024. doi: 10.5306/wjco.v15.i2.329
Published online Feb 24, 2024. doi: 10.5306/wjco.v15.i2.329
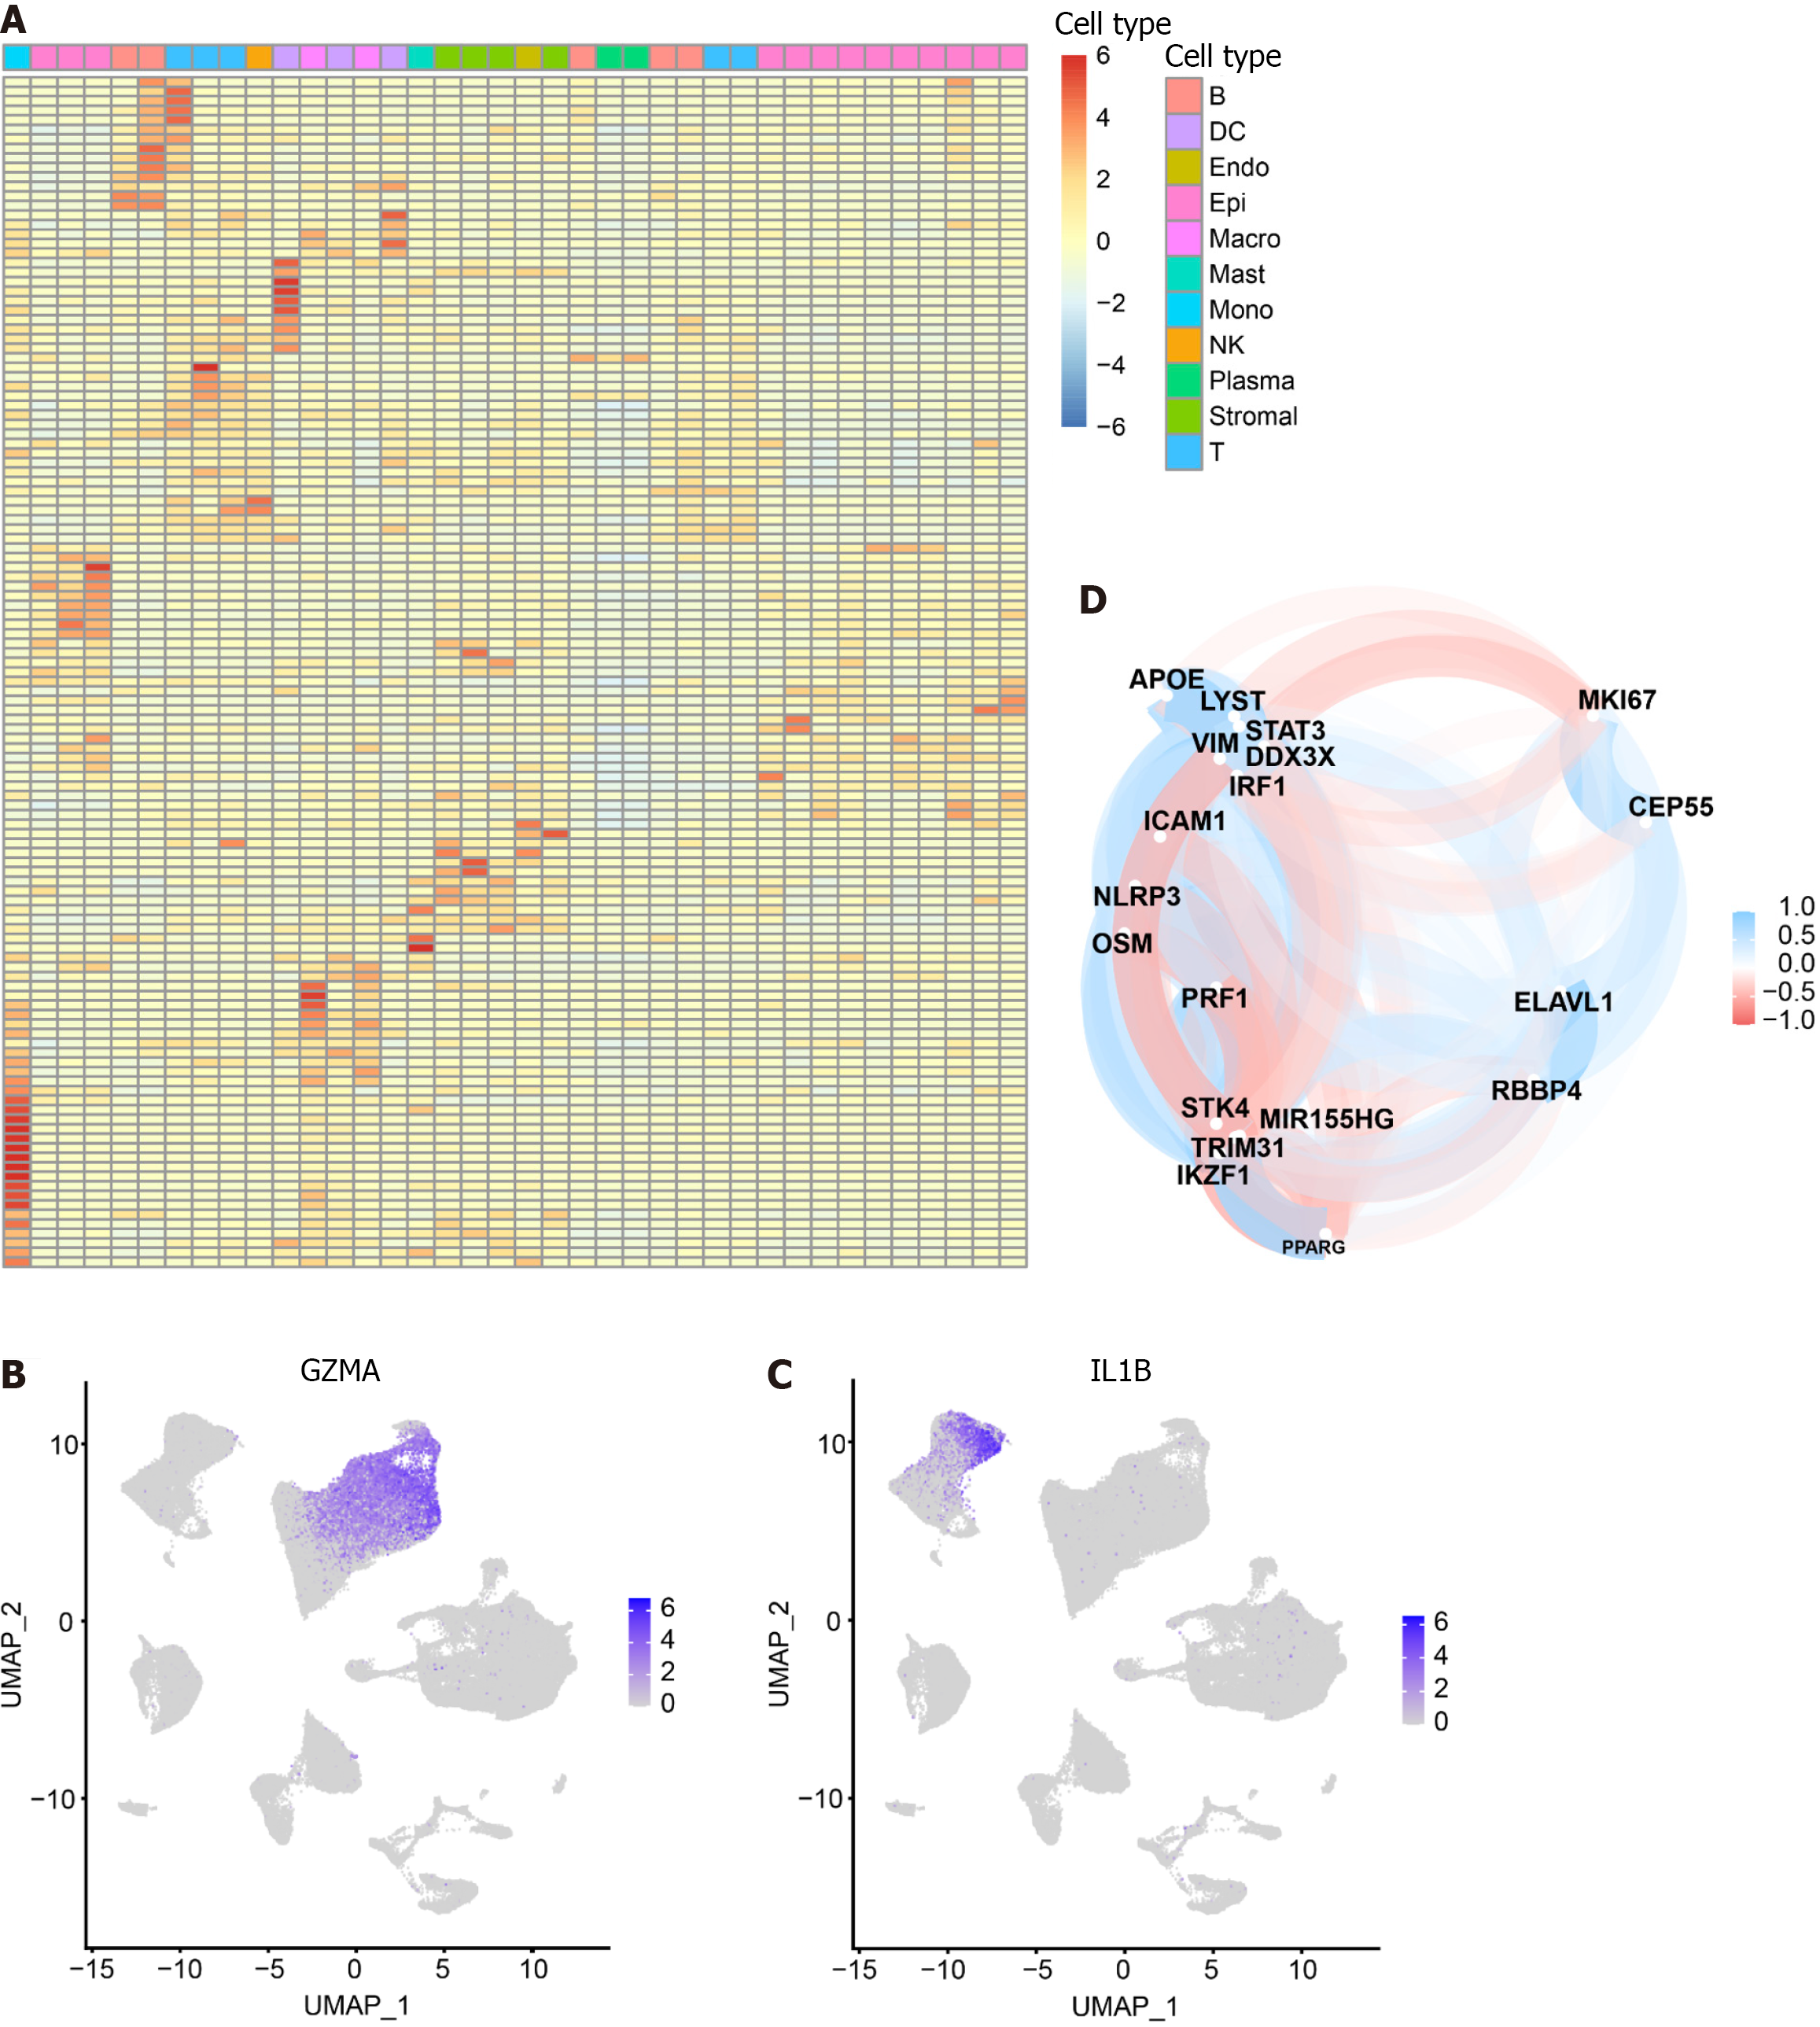
Figure 2 Heat map of 125 pyroptosis-related genes in cell types.
The heat map depicts the expression of 125 pyroptosis-related genes across 11 cell types: T cells, NK cells, B cells, Plasma, Epithelial cells, Myeloid cells (DC, Macrophage, Monocyte), Stromal cells, Mast cells, and Endothelial cells. A: The color gradient from blue to red represents the gradual increase in gene expression; B: Specific expression of GZMA in the cluster where NK cells and T cells are located; C: Specific expression of IL-1B in Monocytes; D: Correlation analysis between pyroptosis-related genes in intersecting cells. Blue represents a negative correlation, while red represents a positive correlation.
- Citation: Zhu LH, Yang J, Zhang YF, Yan L, Lin WR, Liu WQ. Identification and validation of a pyroptosis-related prognostic model for colorectal cancer based on bulk and single-cell RNA sequencing data. World J Clin Oncol 2024; 15(2): 329-355
- URL: https://www.wjgnet.com/2218-4333/full/v15/i2/329.htm
- DOI: https://dx.doi.org/10.5306/wjco.v15.i2.329


