Copyright
©The Author(s) 2024.
World J Clin Oncol. Feb 24, 2024; 15(2): 243-270
Published online Feb 24, 2024. doi: 10.5306/wjco.v15.i2.243
Published online Feb 24, 2024. doi: 10.5306/wjco.v15.i2.243
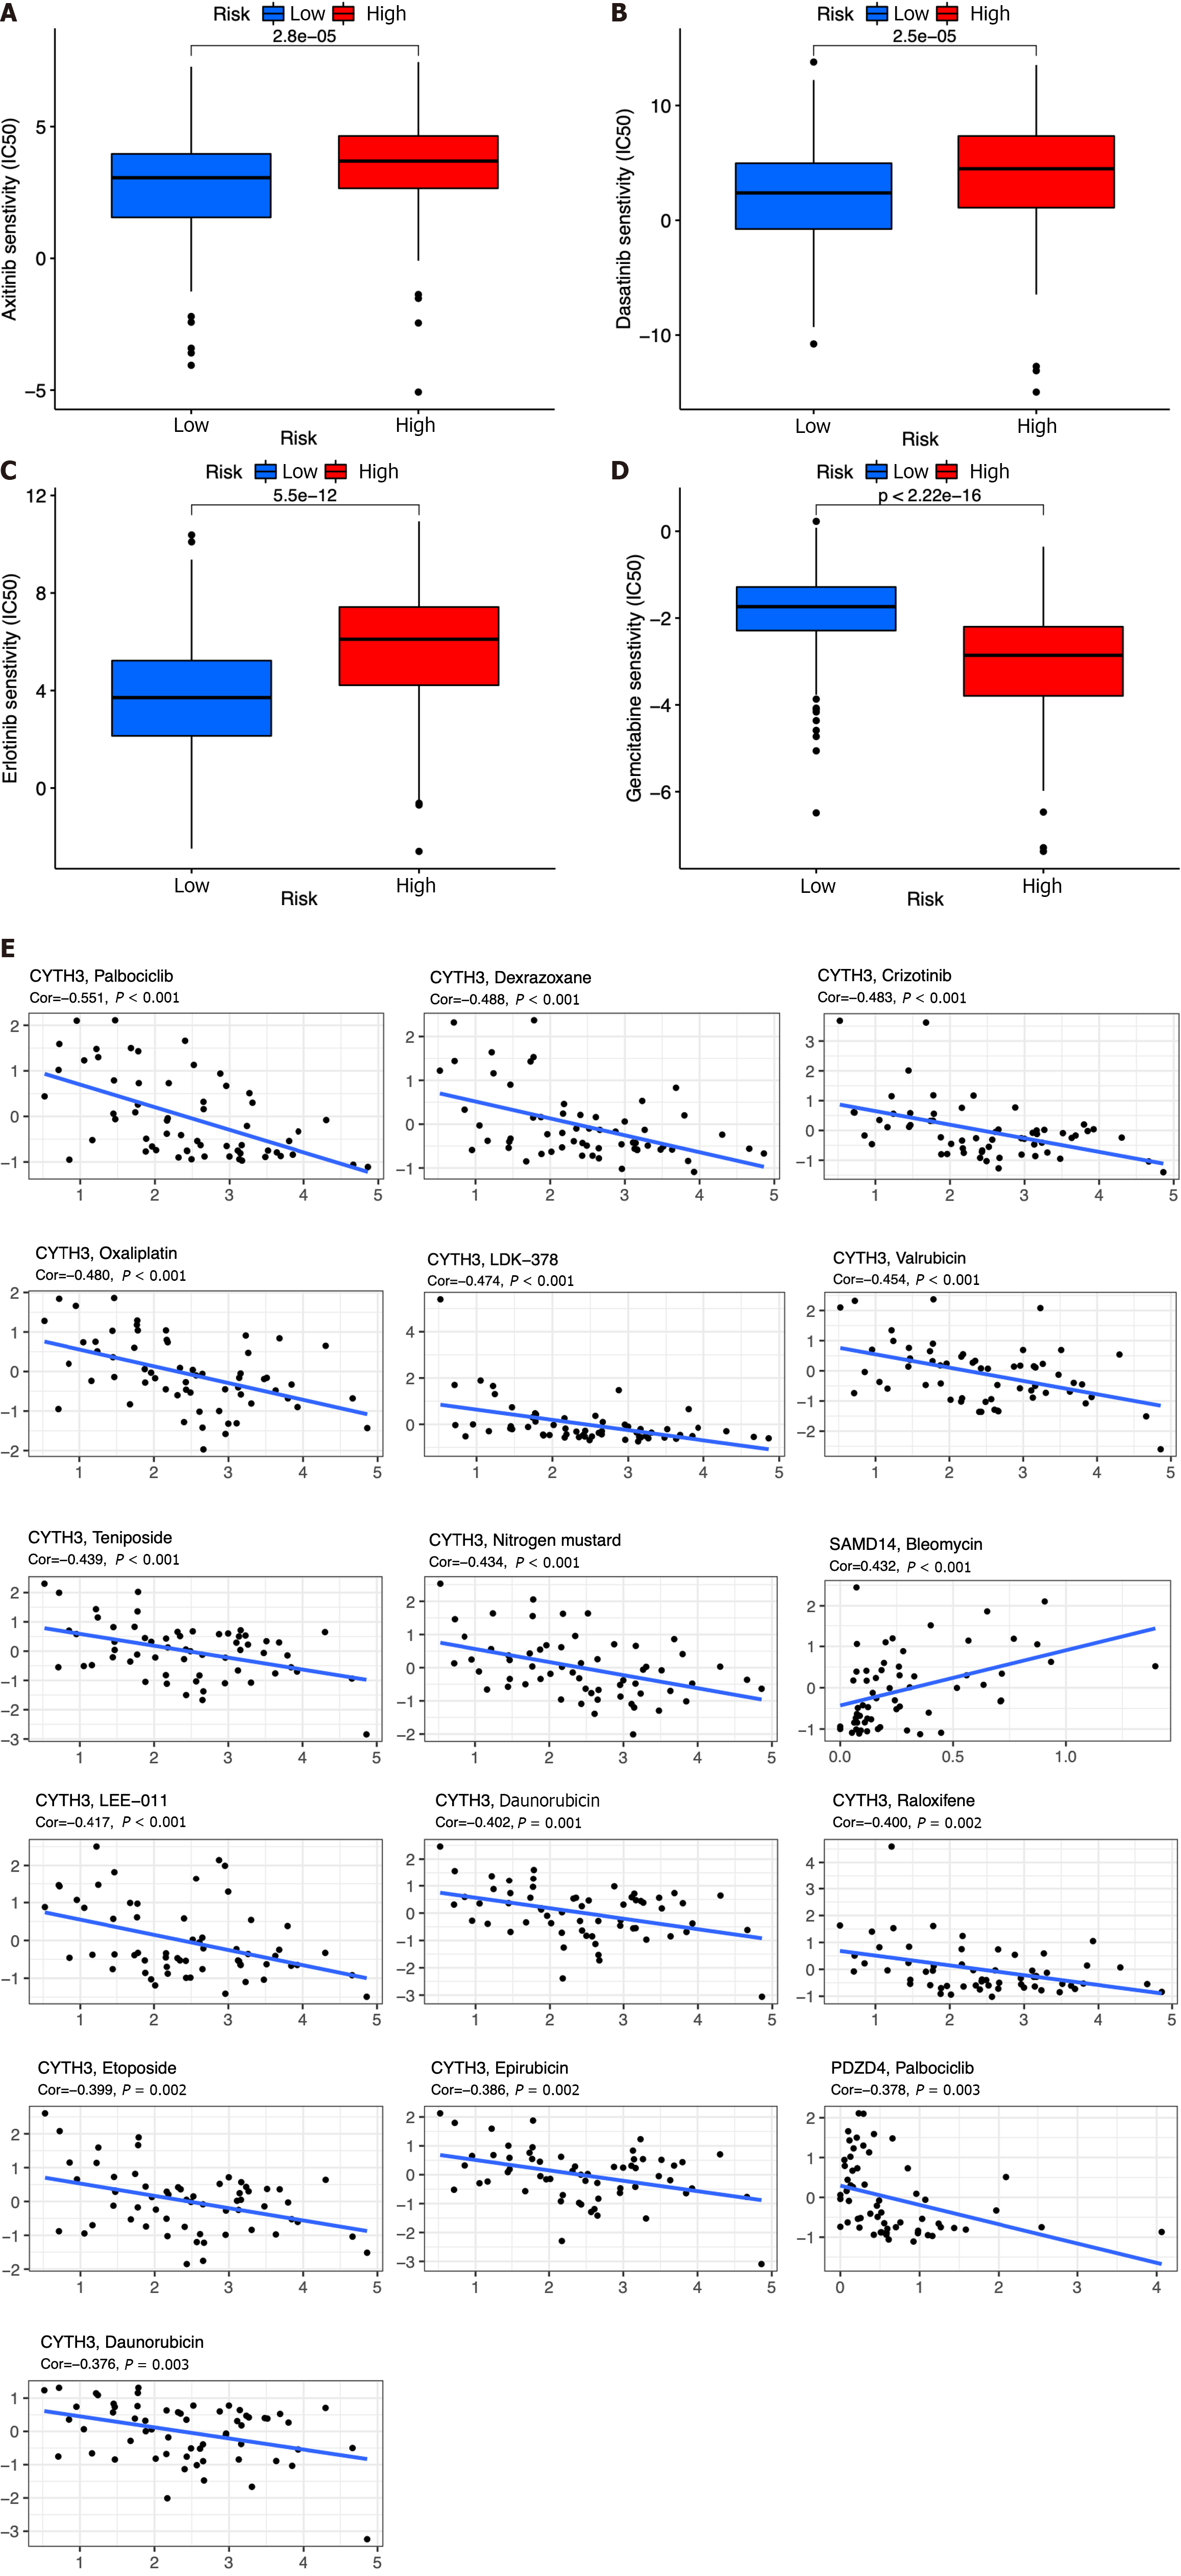
Figure 10 Chemotherapy drug analysis between the high- and low-risk groups in the The Cancer Genome Atlas cohort.
A-D: Different sensitivities to axitinib (A), dasatinib (B), erlotinib (C), and gemcitabine (D) between the high- and low-risk groups; E: Scatter plots of the top 16 correlation analyses between immune cell-related genes and drug sensitivity.
- Citation: Li MT, Zheng KF, Qiu YE. Identification of immune cell-related prognostic genes characterized by a distinct microenvironment in hepatocellular carcinoma. World J Clin Oncol 2024; 15(2): 243-270
- URL: https://www.wjgnet.com/2218-4333/full/v15/i2/243.htm
- DOI: https://dx.doi.org/10.5306/wjco.v15.i2.243


