Copyright
©The Author(s) 2024.
World J Clin Oncol. Feb 24, 2024; 15(2): 243-270
Published online Feb 24, 2024. doi: 10.5306/wjco.v15.i2.243
Published online Feb 24, 2024. doi: 10.5306/wjco.v15.i2.243
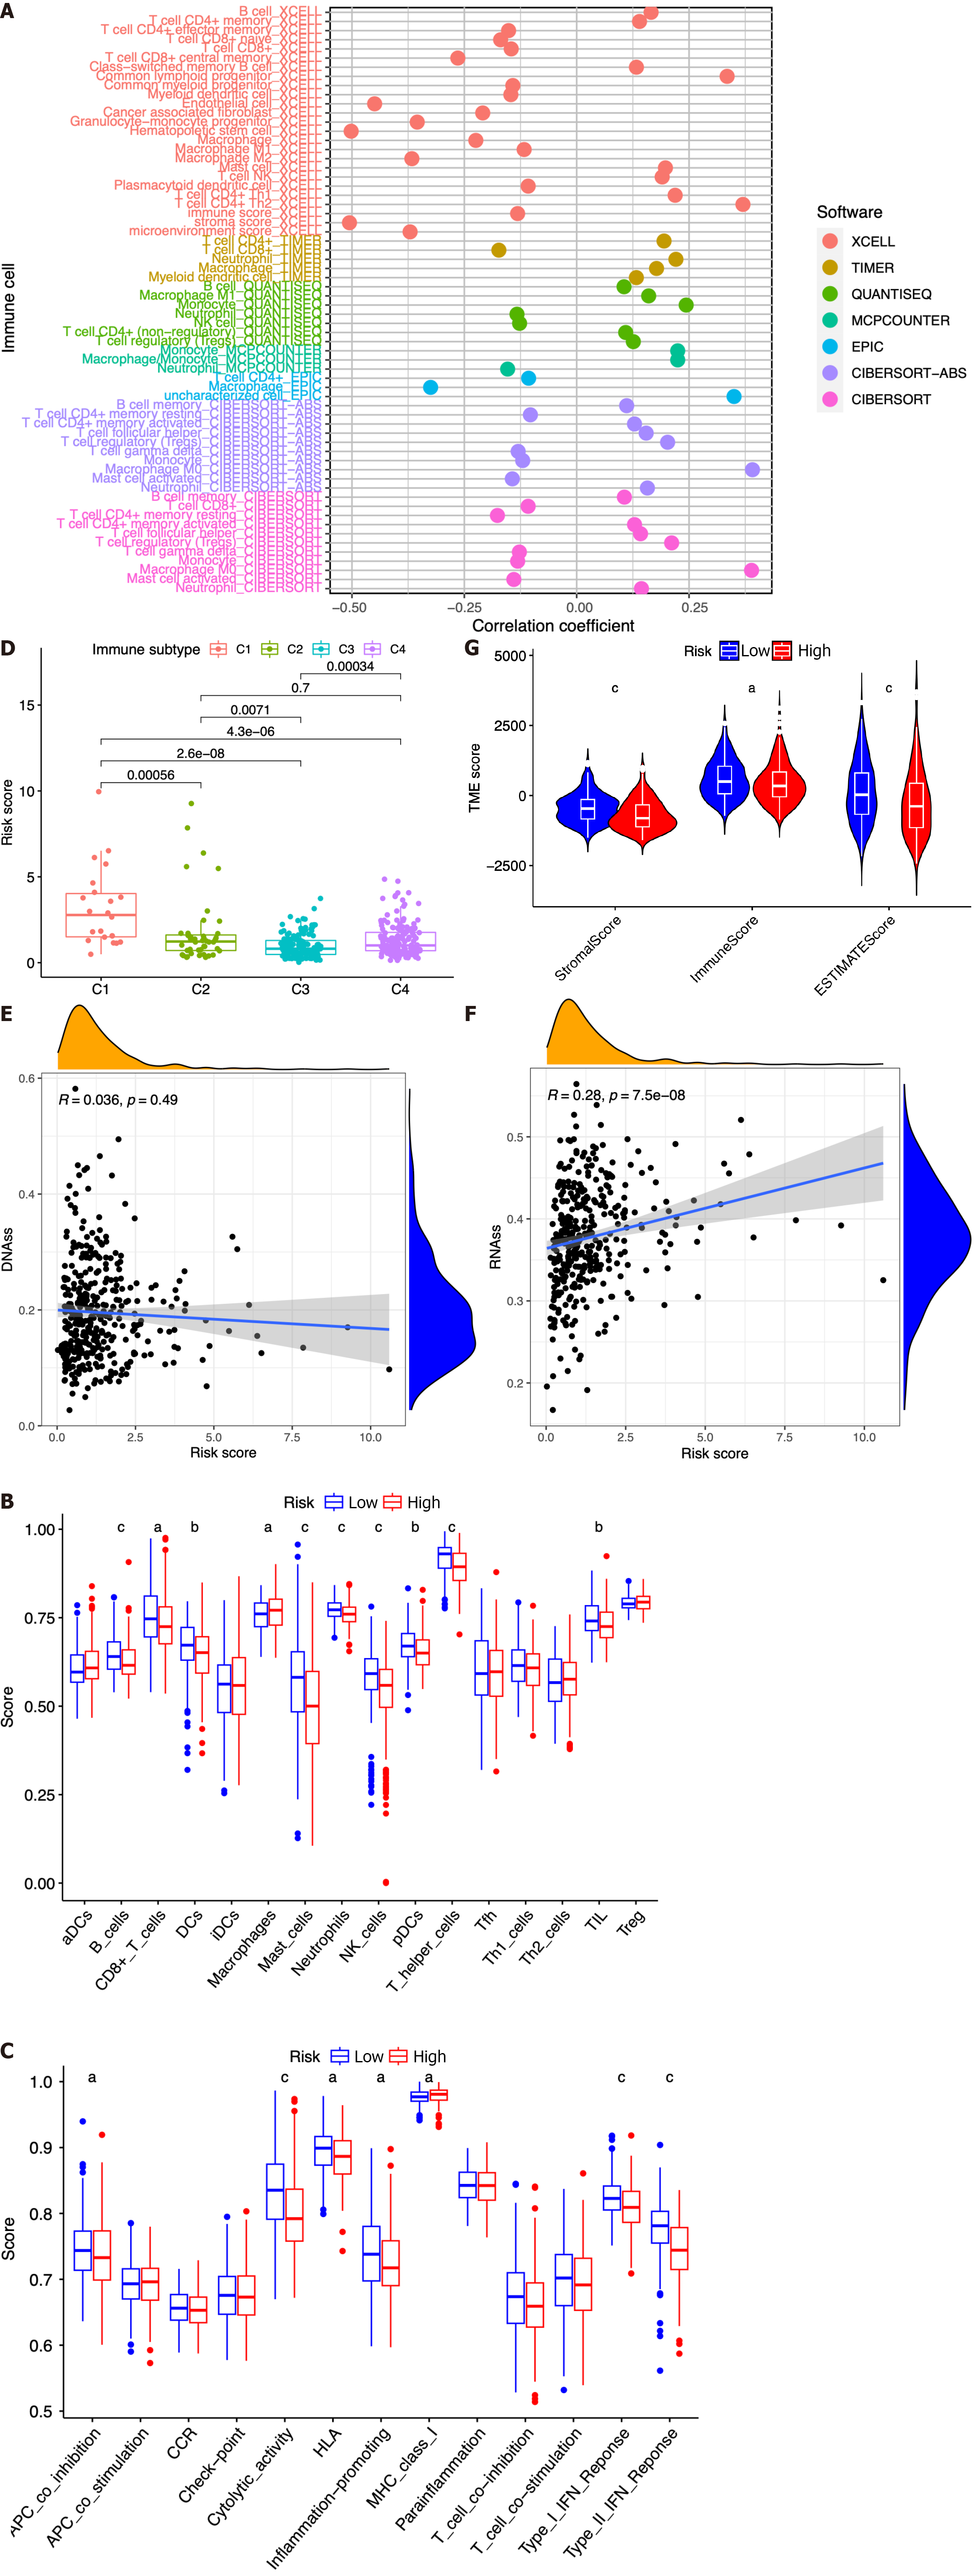
Figure 8 Analysis of tumor microenvironment using the risk model between the high- and low-risk groups based on The Cancer Genome Atlas dataset.
A: Correlation coefficient of immune cells in seven software programs; B: Boxplot showing significant differences among the seven types of immune cells; C: Boxplot showing the scores of 13 immune-related functions; D: Comparison of different immune infiltration subtypes based on different risk scores; E and F: Correlation between the risk score and DNAss (E) and RNAss (F); G: Association of stromal, immune, and estimate scores with the tumor microenvironment score. cP < 0.001, bP < 0.01, aP < 0.05.
- Citation: Li MT, Zheng KF, Qiu YE. Identification of immune cell-related prognostic genes characterized by a distinct microenvironment in hepatocellular carcinoma. World J Clin Oncol 2024; 15(2): 243-270
- URL: https://www.wjgnet.com/2218-4333/full/v15/i2/243.htm
- DOI: https://dx.doi.org/10.5306/wjco.v15.i2.243


