Copyright
©The Author(s) 2024.
World J Clin Oncol. Feb 24, 2024; 15(2): 243-270
Published online Feb 24, 2024. doi: 10.5306/wjco.v15.i2.243
Published online Feb 24, 2024. doi: 10.5306/wjco.v15.i2.243
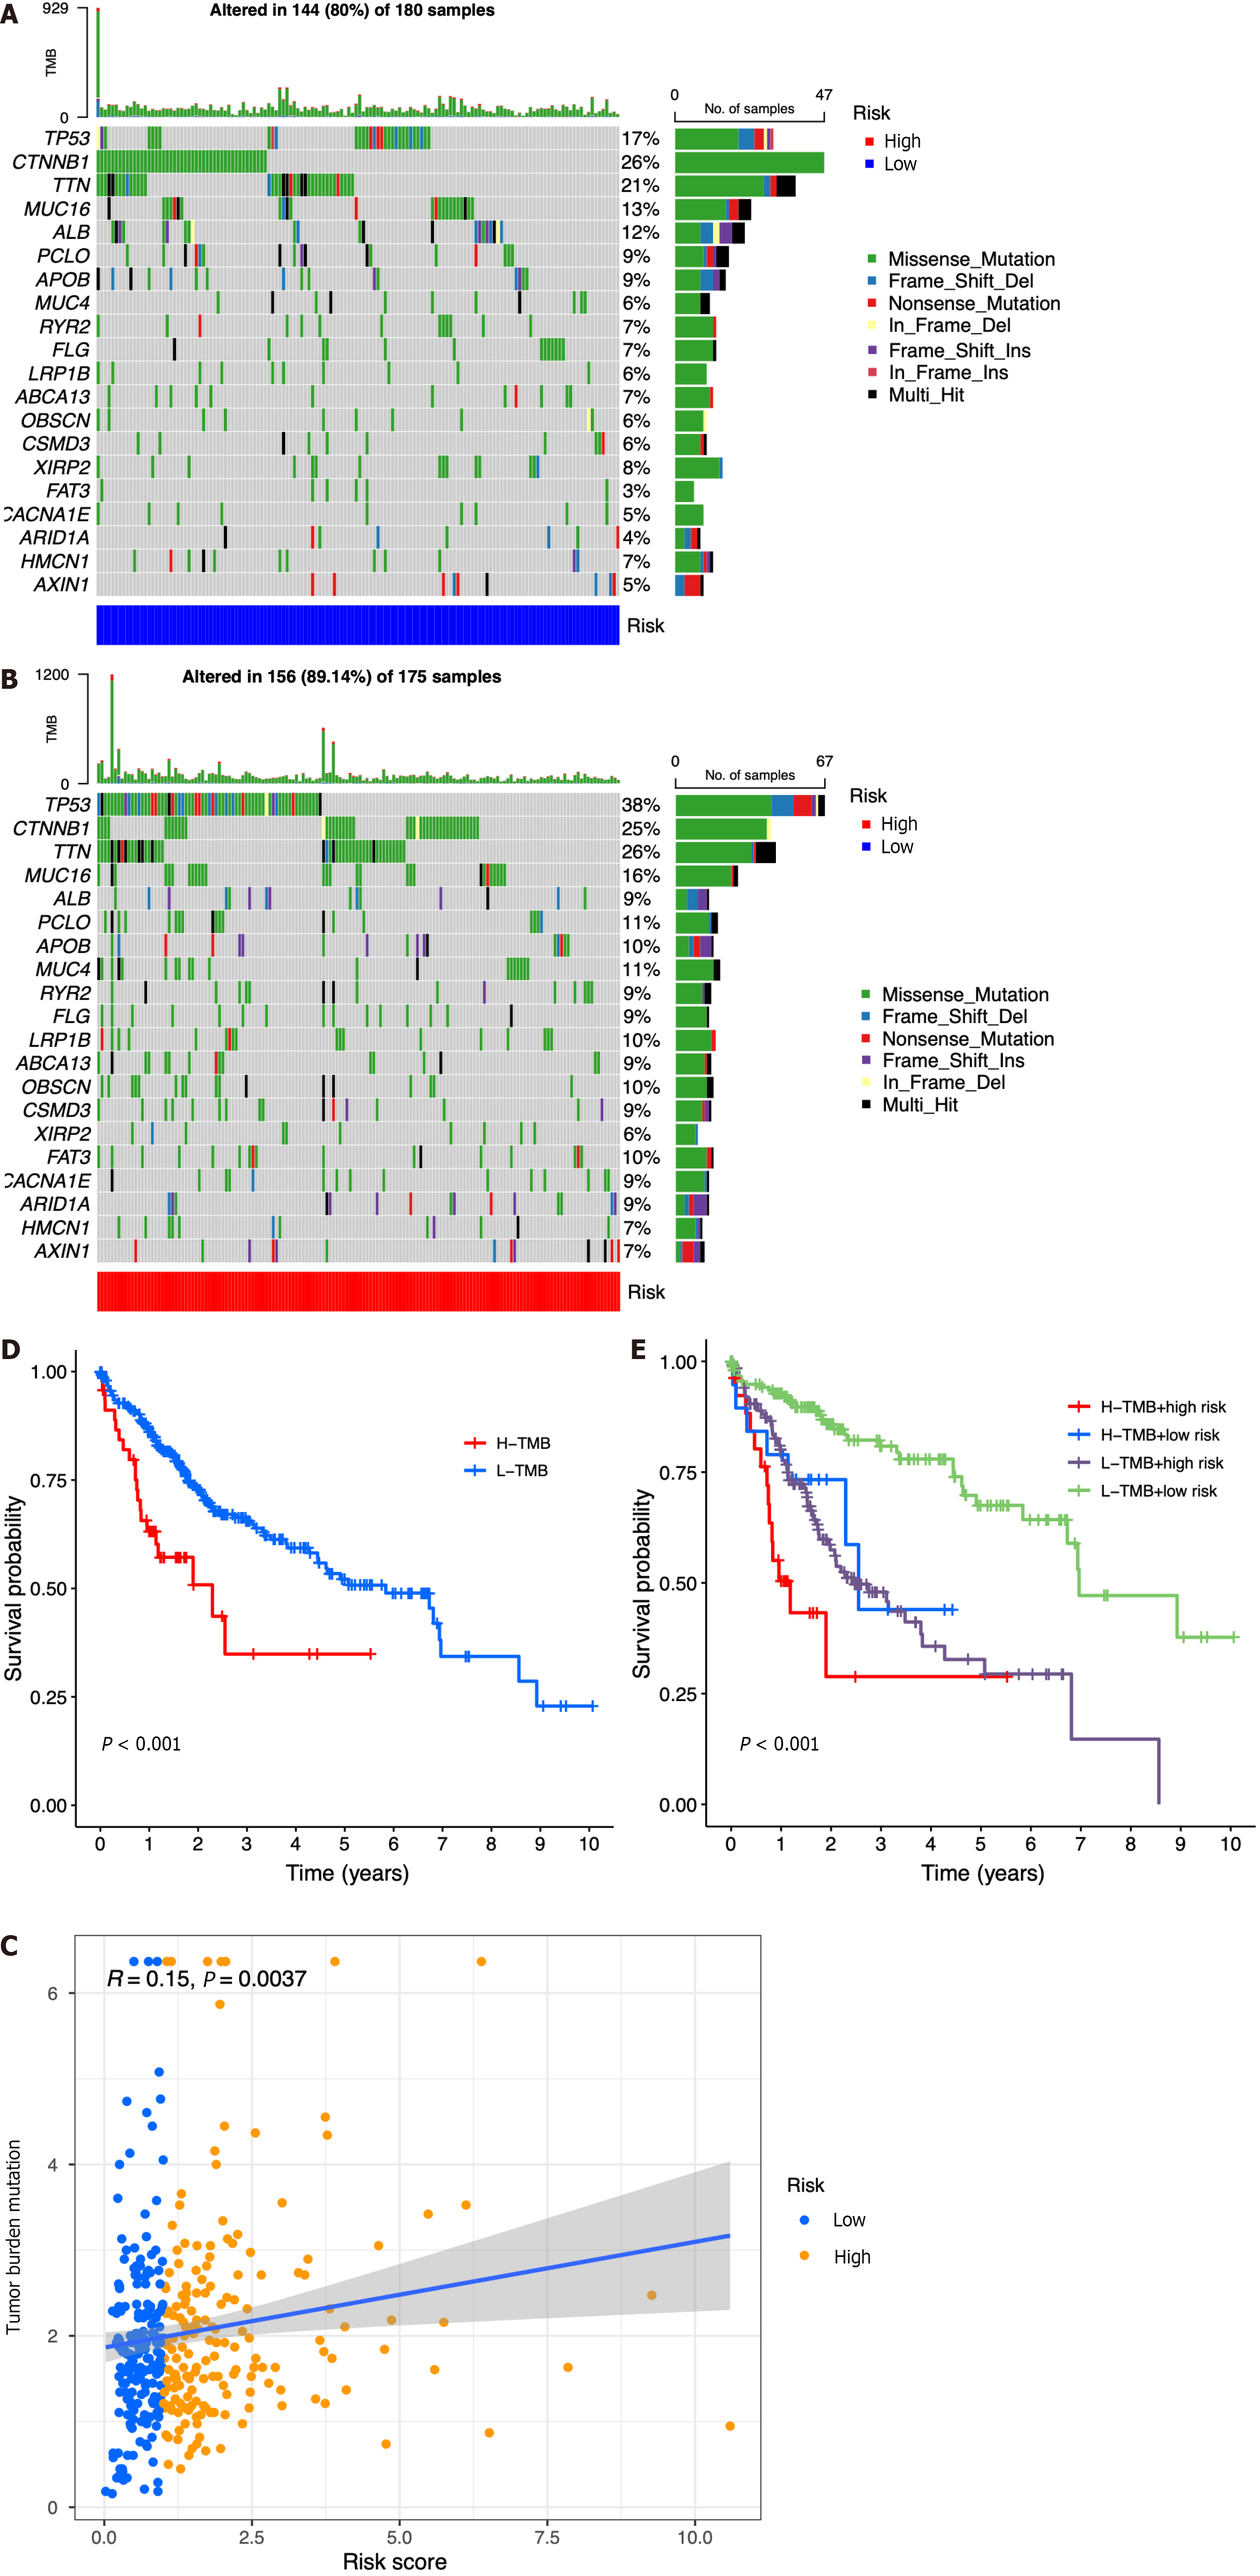
Figure 7 Relationship among the seven-gene prognostic model, genomic features, and tumor mutation burden.
A: List of the most frequently altered genes in the low-risk group; B List of the most frequently altered genes in the high-risk group; C: Scatter plot of the relationship between the risk score and tumor mutation burden (TMB); D: Kaplan-Meier analysis of survival probability for the high- and low-risk groups; E: Kaplan-Meier analysis of survival probability for the high-TMB + high-risk, high-TMB + low-risk, low-TMB + high-risk, and low-TMB + low-risk groups. H-TMB: High-TMB; L-TMB: Low-TMB.
- Citation: Li MT, Zheng KF, Qiu YE. Identification of immune cell-related prognostic genes characterized by a distinct microenvironment in hepatocellular carcinoma. World J Clin Oncol 2024; 15(2): 243-270
- URL: https://www.wjgnet.com/2218-4333/full/v15/i2/243.htm
- DOI: https://dx.doi.org/10.5306/wjco.v15.i2.243


