Copyright
©The Author(s) 2024.
World J Clin Oncol. Feb 24, 2024; 15(2): 243-270
Published online Feb 24, 2024. doi: 10.5306/wjco.v15.i2.243
Published online Feb 24, 2024. doi: 10.5306/wjco.v15.i2.243
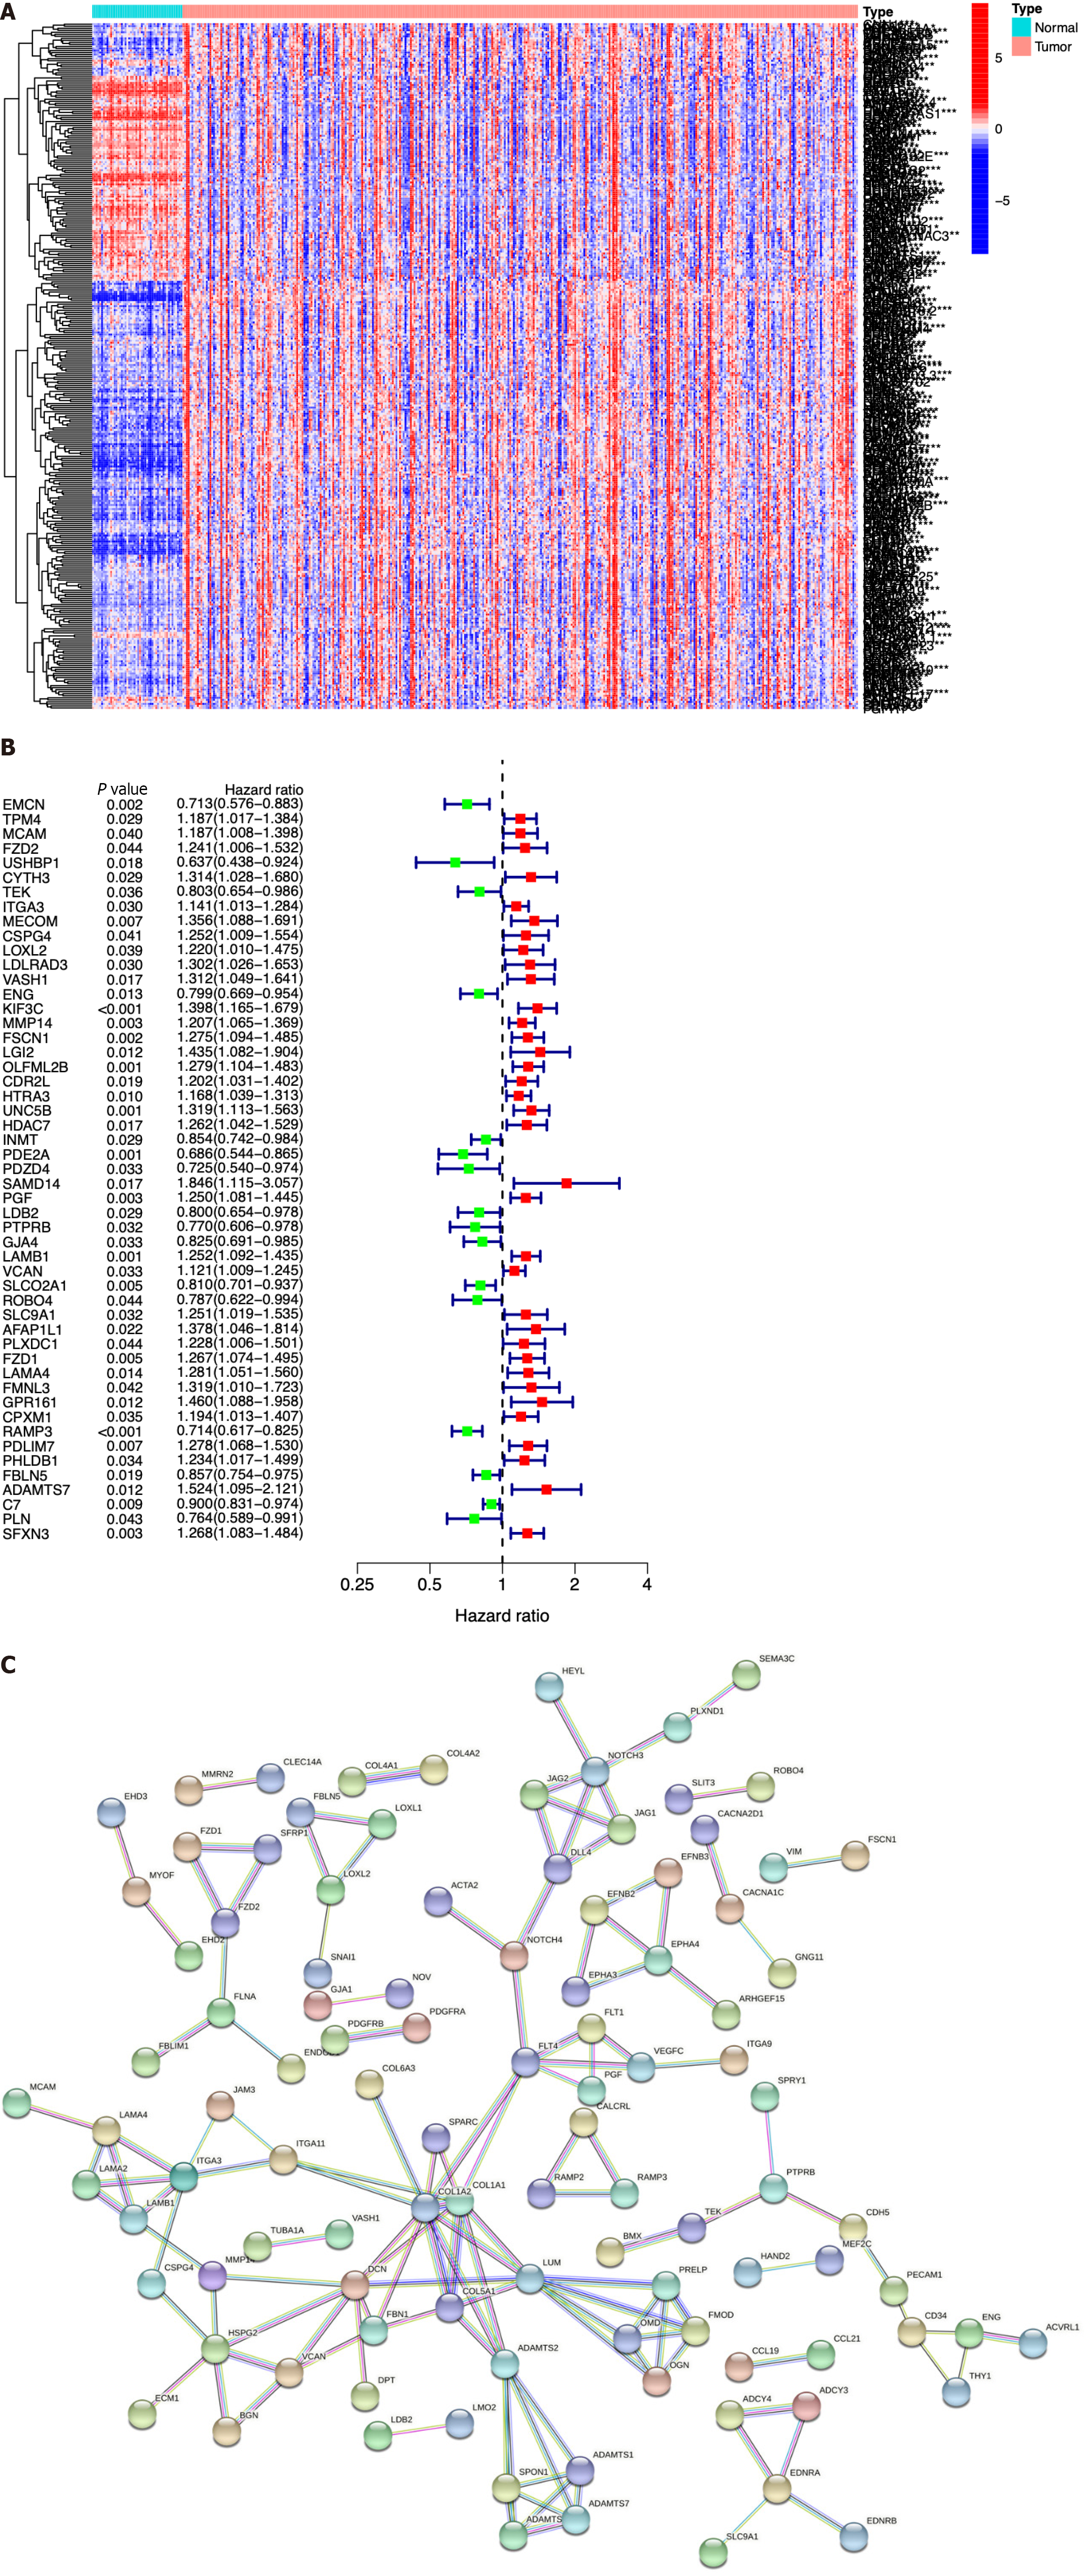
Figure 2 Identification of immune cell-related genes by array screening.
A: Heatmap of the identified immune cell-related genes (ICRGs) between the tumor group and the normal group. Blue: Low expression level; red: High expression level; B: Protein-protein interaction network of the genes (cutoff = 0.9); C: Univariate Cox regression analysis of ICRGs.
- Citation: Li MT, Zheng KF, Qiu YE. Identification of immune cell-related prognostic genes characterized by a distinct microenvironment in hepatocellular carcinoma. World J Clin Oncol 2024; 15(2): 243-270
- URL: https://www.wjgnet.com/2218-4333/full/v15/i2/243.htm
- DOI: https://dx.doi.org/10.5306/wjco.v15.i2.243


