Copyright
©The Author(s) 2024.
World J Clin Oncol. Feb 24, 2024; 15(2): 208-242
Published online Feb 24, 2024. doi: 10.5306/wjco.v15.i2.208
Published online Feb 24, 2024. doi: 10.5306/wjco.v15.i2.208
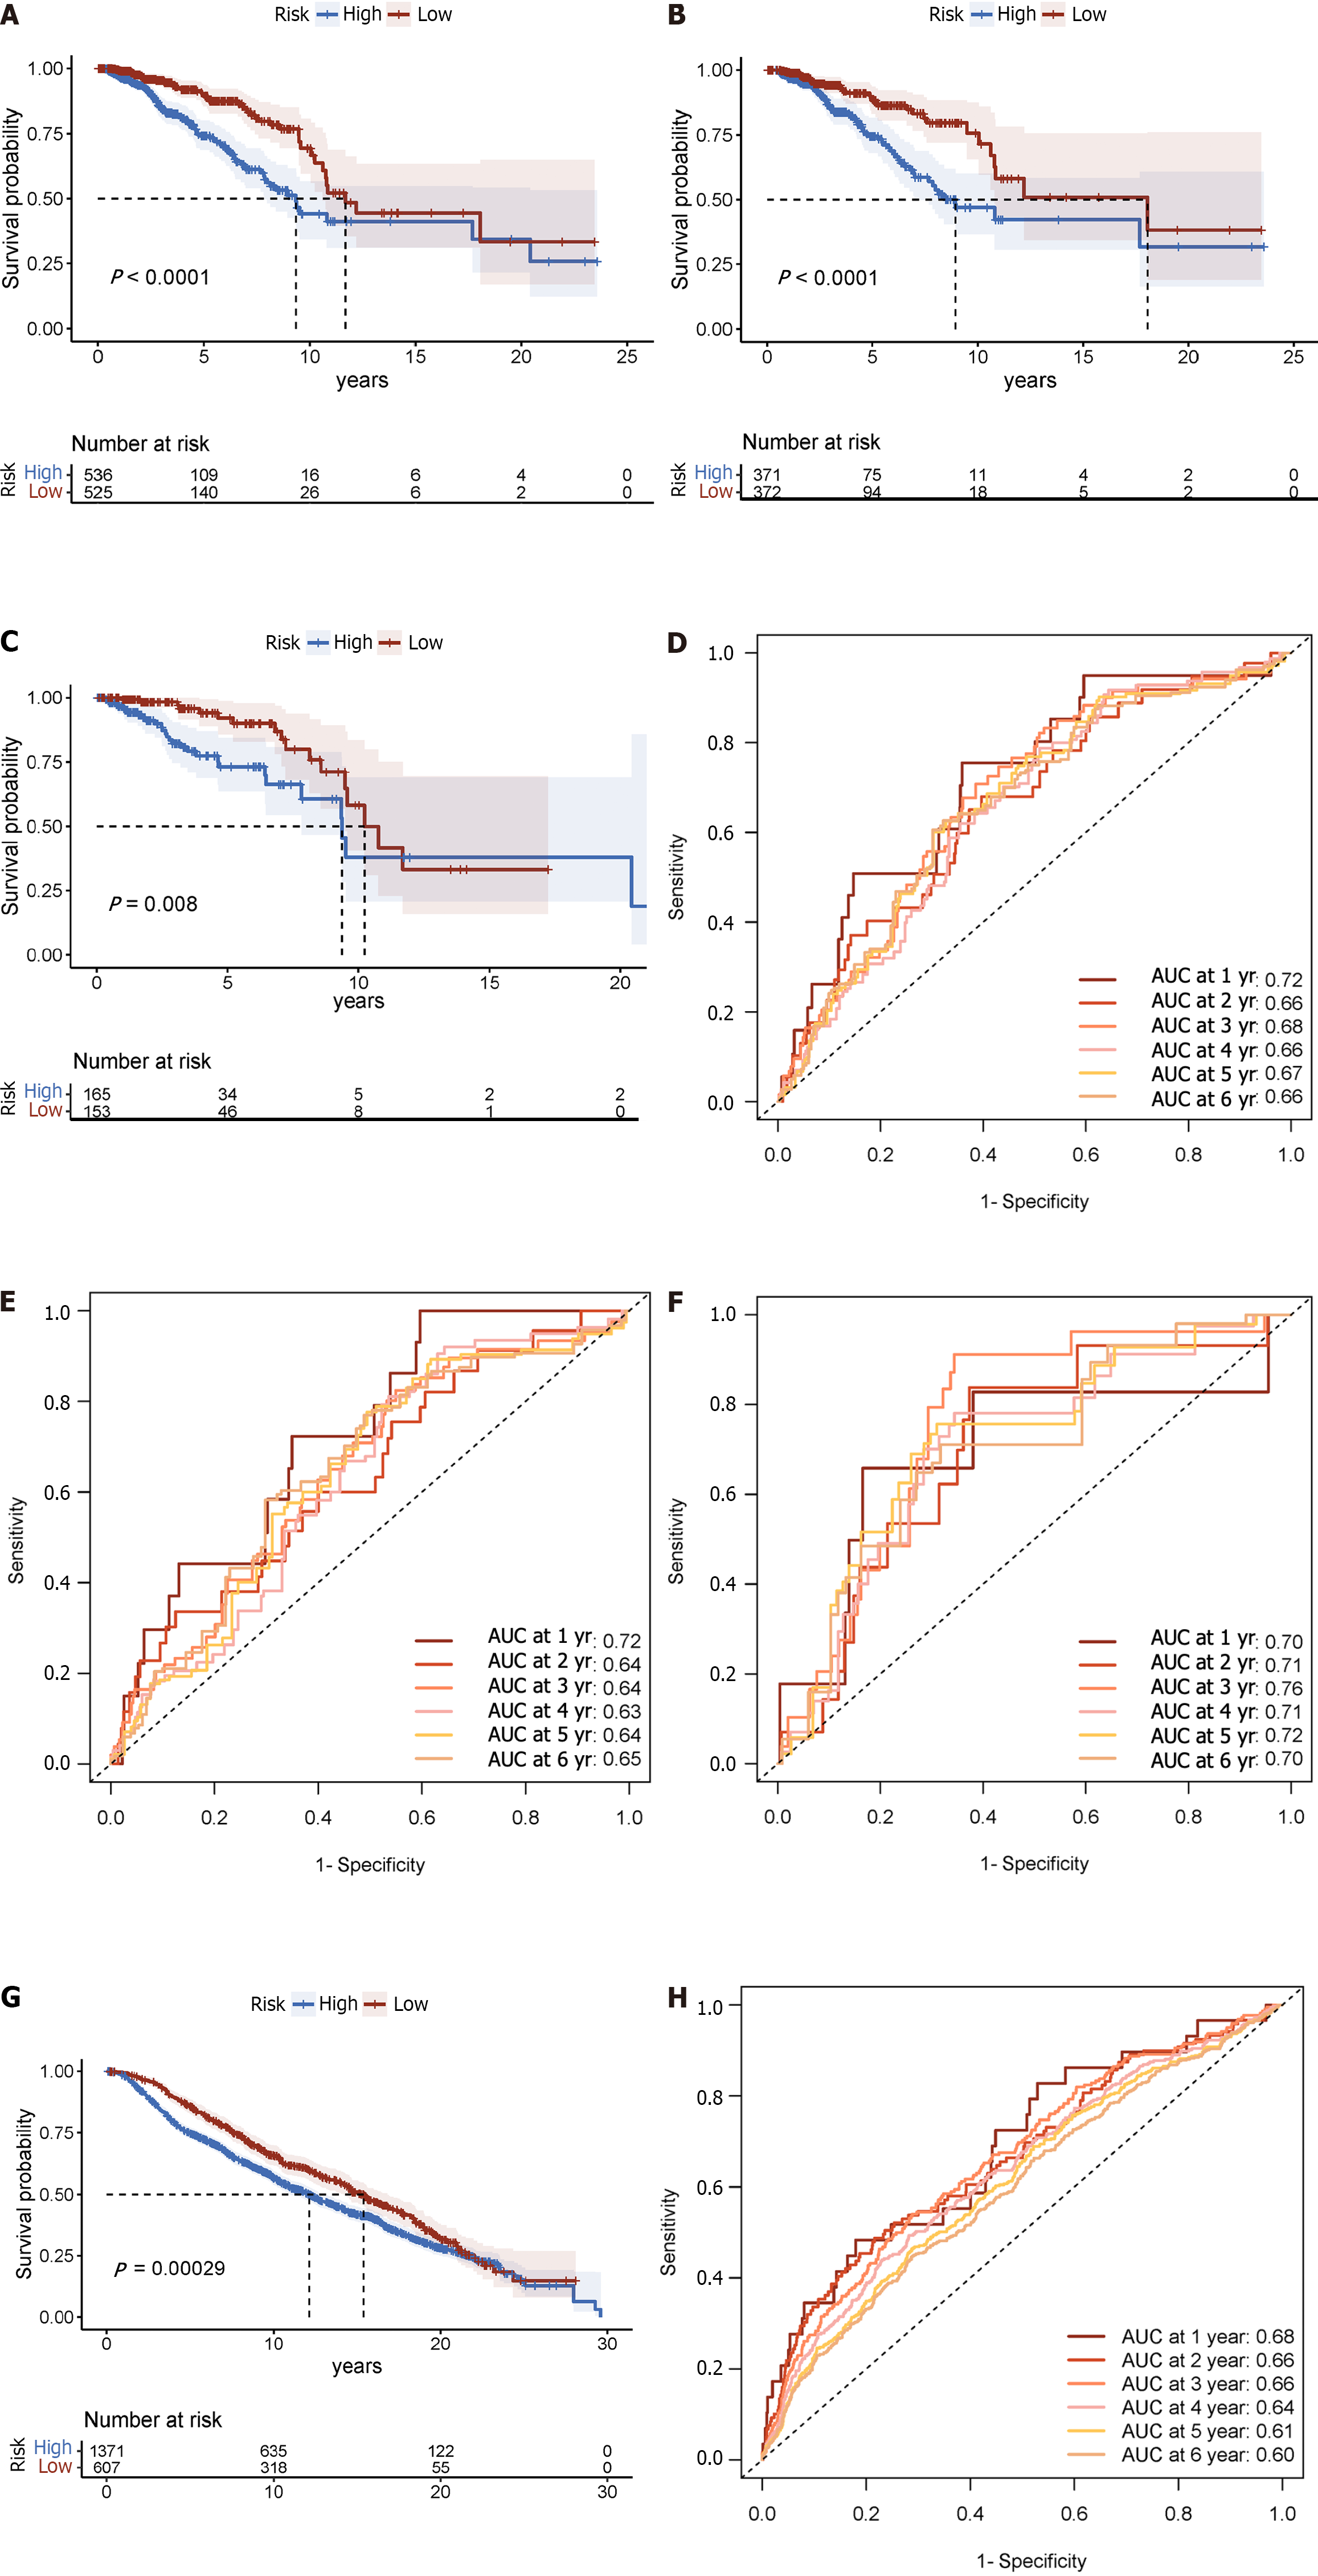
Figure 3 Displays time-varying receiver operating characteristic curves and Kaplan-Meier survival analyses.
A: In the complete dataset, the Kaplan-Meier survival analysis curve revealed a substantial difference in overall survival (OS) among the low-risk and high-risk groups; B: As well as in the training; C: Validation cohorts; D: The time-varying receiver operating characteristic curve area under the curve values for the total dataset; E: Training group; F: Validation group at 5 yr of OS were 0.67, 0.64, and 0.72, respectively; G: Kaplan-Meier survival analysis; H: Receiver operating characteristic curve over time.
- Citation: Zhang HL, Doblin S, Zhang ZW, Song ZJ, Dinesh B, Tabana Y, Saad DS, Adam Ahmed Adam M, Wang Y, Wang W, Zhang HL, Wu S, Zhao R, Khaled B. Elucidating the molecular basis of ATP-induced cell death in breast cancer: Construction of a robust prognostic model. World J Clin Oncol 2024; 15(2): 208-242
- URL: https://www.wjgnet.com/2218-4333/full/v15/i2/208.htm
- DOI: https://dx.doi.org/10.5306/wjco.v15.i2.208


