Copyright
©The Author(s) 2024.
World J Clin Oncol. Dec 24, 2024; 15(12): 1491-1500
Published online Dec 24, 2024. doi: 10.5306/wjco.v15.i12.1491
Published online Dec 24, 2024. doi: 10.5306/wjco.v15.i12.1491
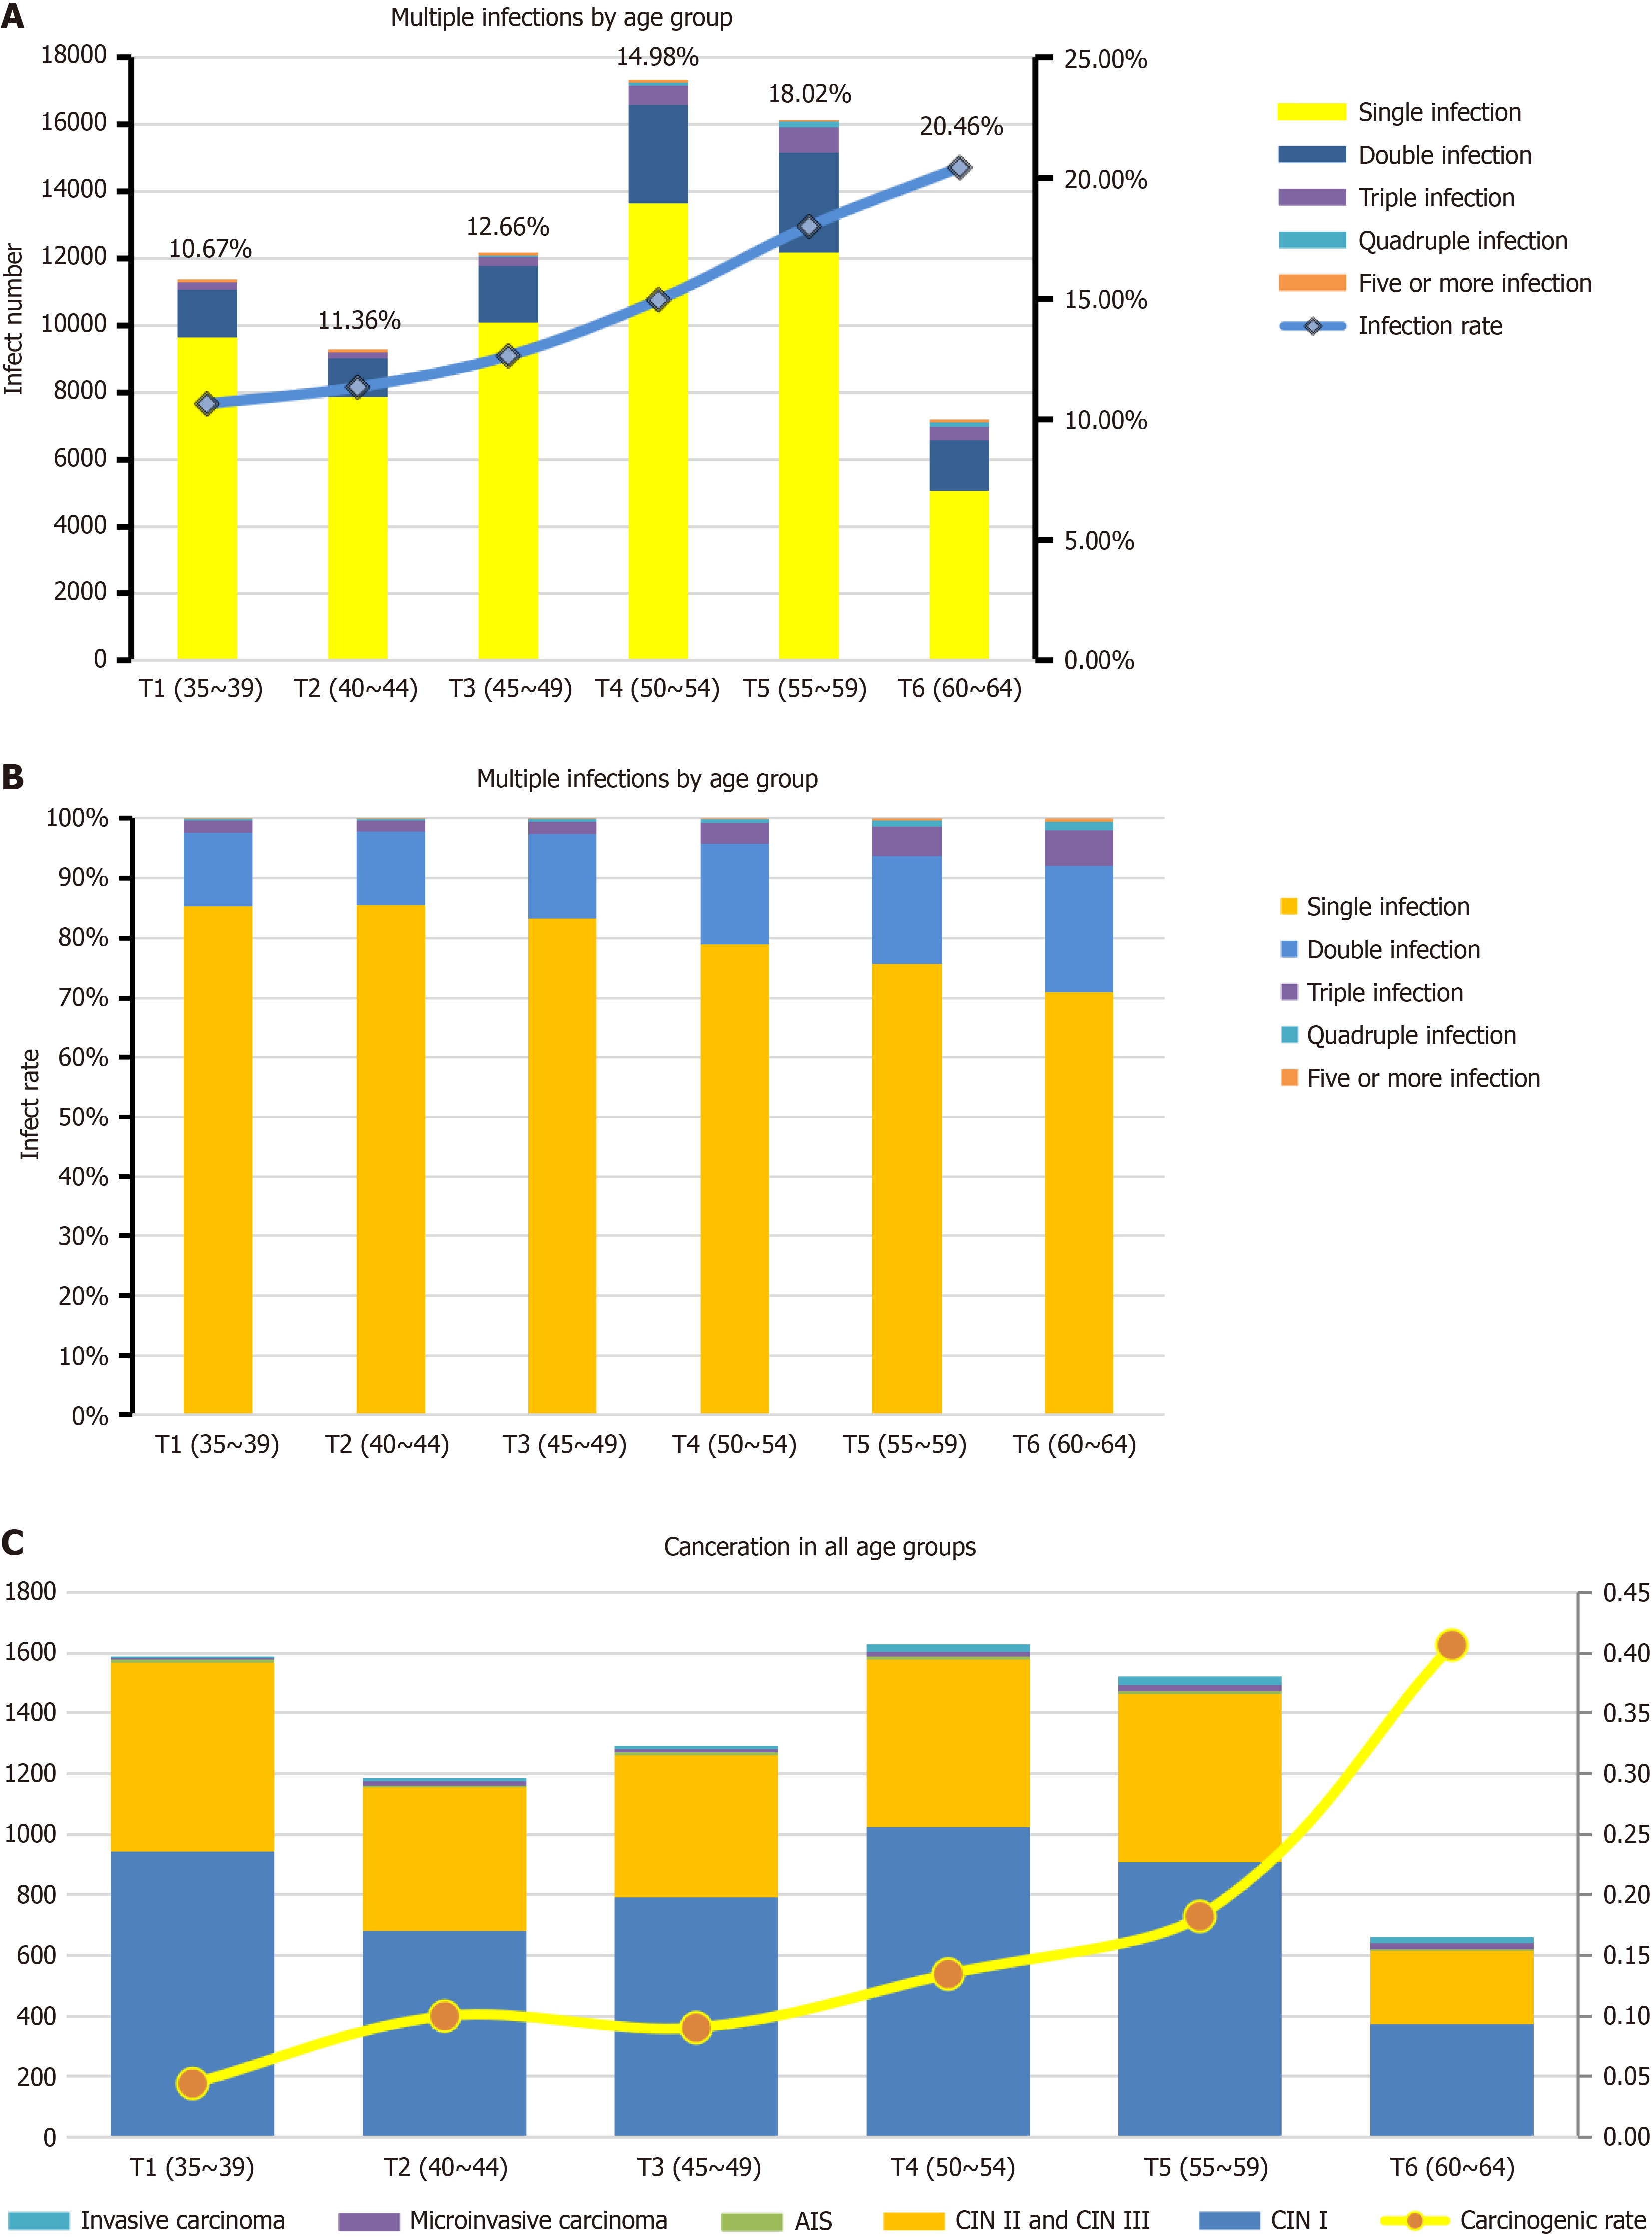
Figure 2 Characteristics of human papillomavirus infection in Changsha city.
A: The stacked bar charts show the incidence of infection at different ages. The abscissa indicates the age, the left ordinate indicates the number of people in the bar, and the right ordinate indicates the infection rate of the line; B: The percentage bar chart shows infection at different ages; C: The stacked bar charts show the incidence of cancer at different ages. The data were calculated and sorted by Excel. CIN: Cervical intraepithelial neoplasia.
- Citation: Zu YE, Wang SF, Peng XX, Wen YC, Shen XX, Wang XL, Liao WB, Jia D, Liu JY, Peng XW. New cheaper human papilloma virus mass screening strategy reduces cervical cancer incidence in Changsha city: A clinical trial. World J Clin Oncol 2024; 15(12): 1491-1500
- URL: https://www.wjgnet.com/2218-4333/full/v15/i12/1491.htm
- DOI: https://dx.doi.org/10.5306/wjco.v15.i12.1491


