Copyright
©The Author(s) 2024.
World J Clin Oncol. Nov 24, 2024; 15(11): 1412-1427
Published online Nov 24, 2024. doi: 10.5306/wjco.v15.i11.1412
Published online Nov 24, 2024. doi: 10.5306/wjco.v15.i11.1412
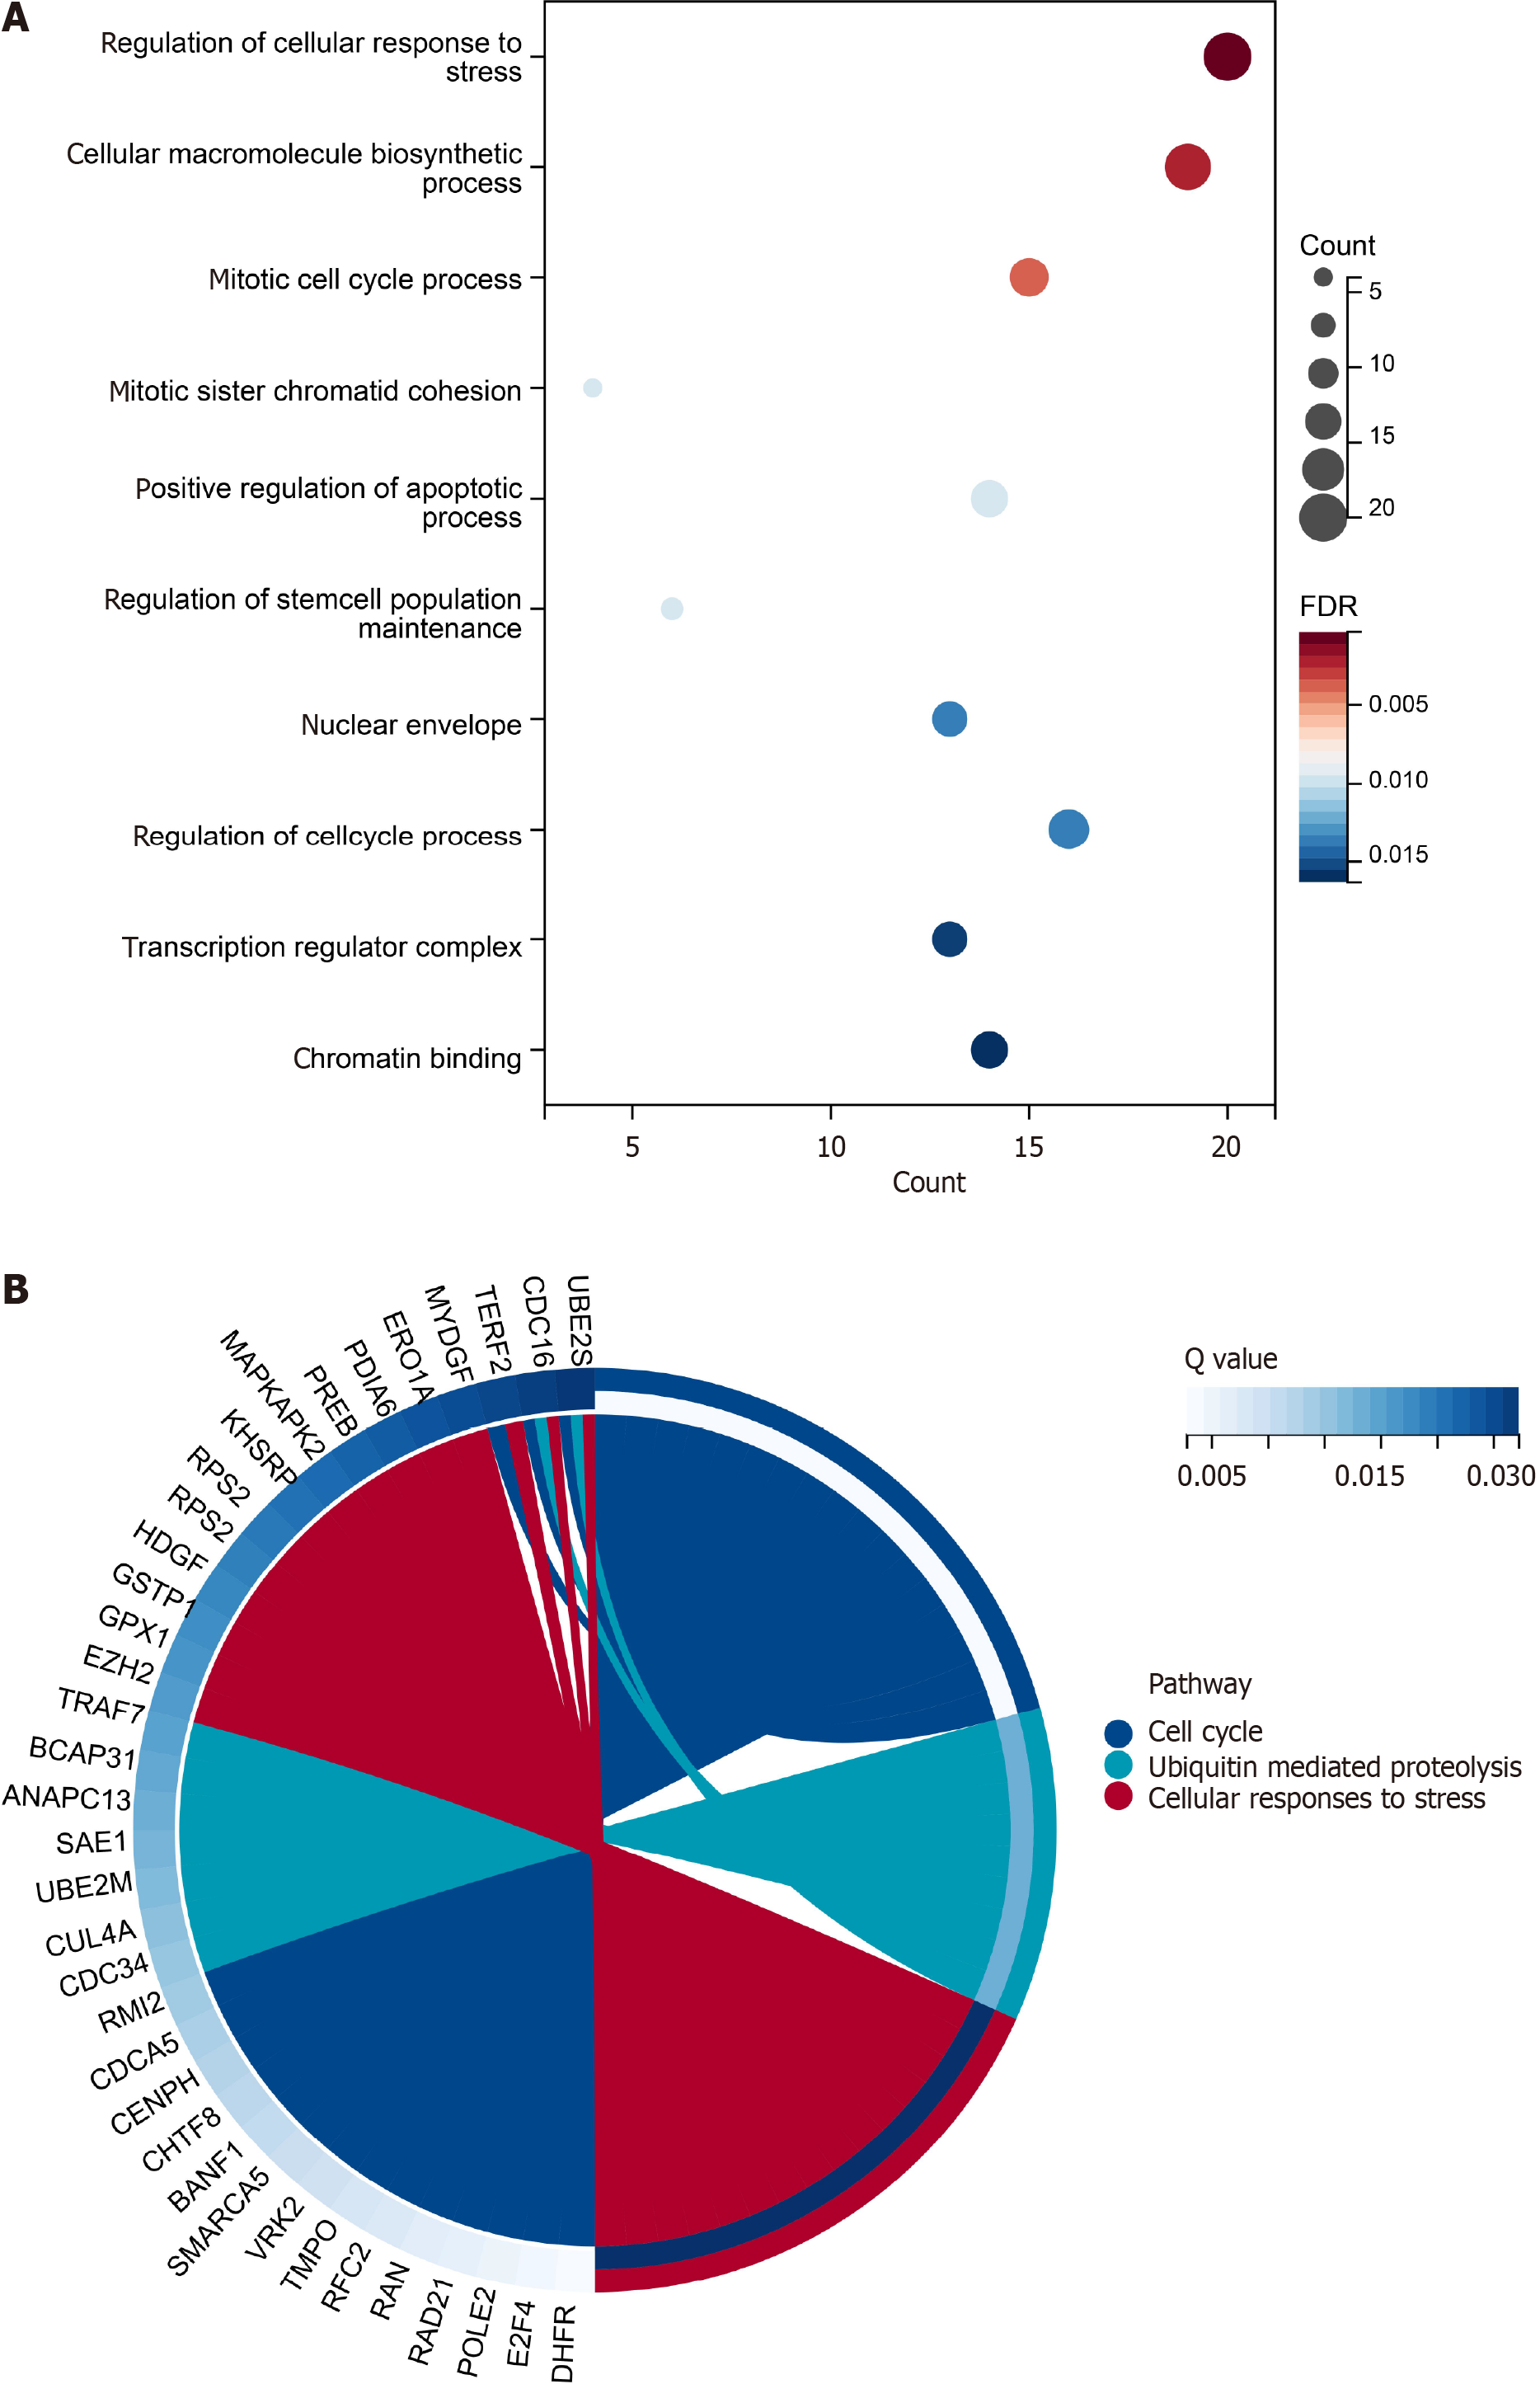
Figure 6 Enrichment analyses based on gene ontology and the Kyoto Encyclopedia of Genes and Genomes items.
A: Gene ontology (GO) enrichment analysis. The size was the genes enriched in the items and the red color meant high statistical significance. The top ten items in GO database were displayed in the bubble chart; B: The left semicircle was the genes enriched in the pathways in the chord diagram. Only three pathways had the statistical significance.
- Citation: Li H, Huang HQ, Huang ZG, He RQ, Fang YY, Song R, Luo JY, Zeng DT, Qin K, Wei DM, Chen G. Potential regulatory mechanism and clinical significance of synaptotagmin binding cytoplasmic RNA interacting protein in colorectal cancer. World J Clin Oncol 2024; 15(11): 1412-1427
- URL: https://www.wjgnet.com/2218-4333/full/v15/i11/1412.htm
- DOI: https://dx.doi.org/10.5306/wjco.v15.i11.1412


