Copyright
©The Author(s) 2024.
World J Clin Oncol. Oct 24, 2024; 15(10): 1280-1292
Published online Oct 24, 2024. doi: 10.5306/wjco.v15.i10.1280
Published online Oct 24, 2024. doi: 10.5306/wjco.v15.i10.1280
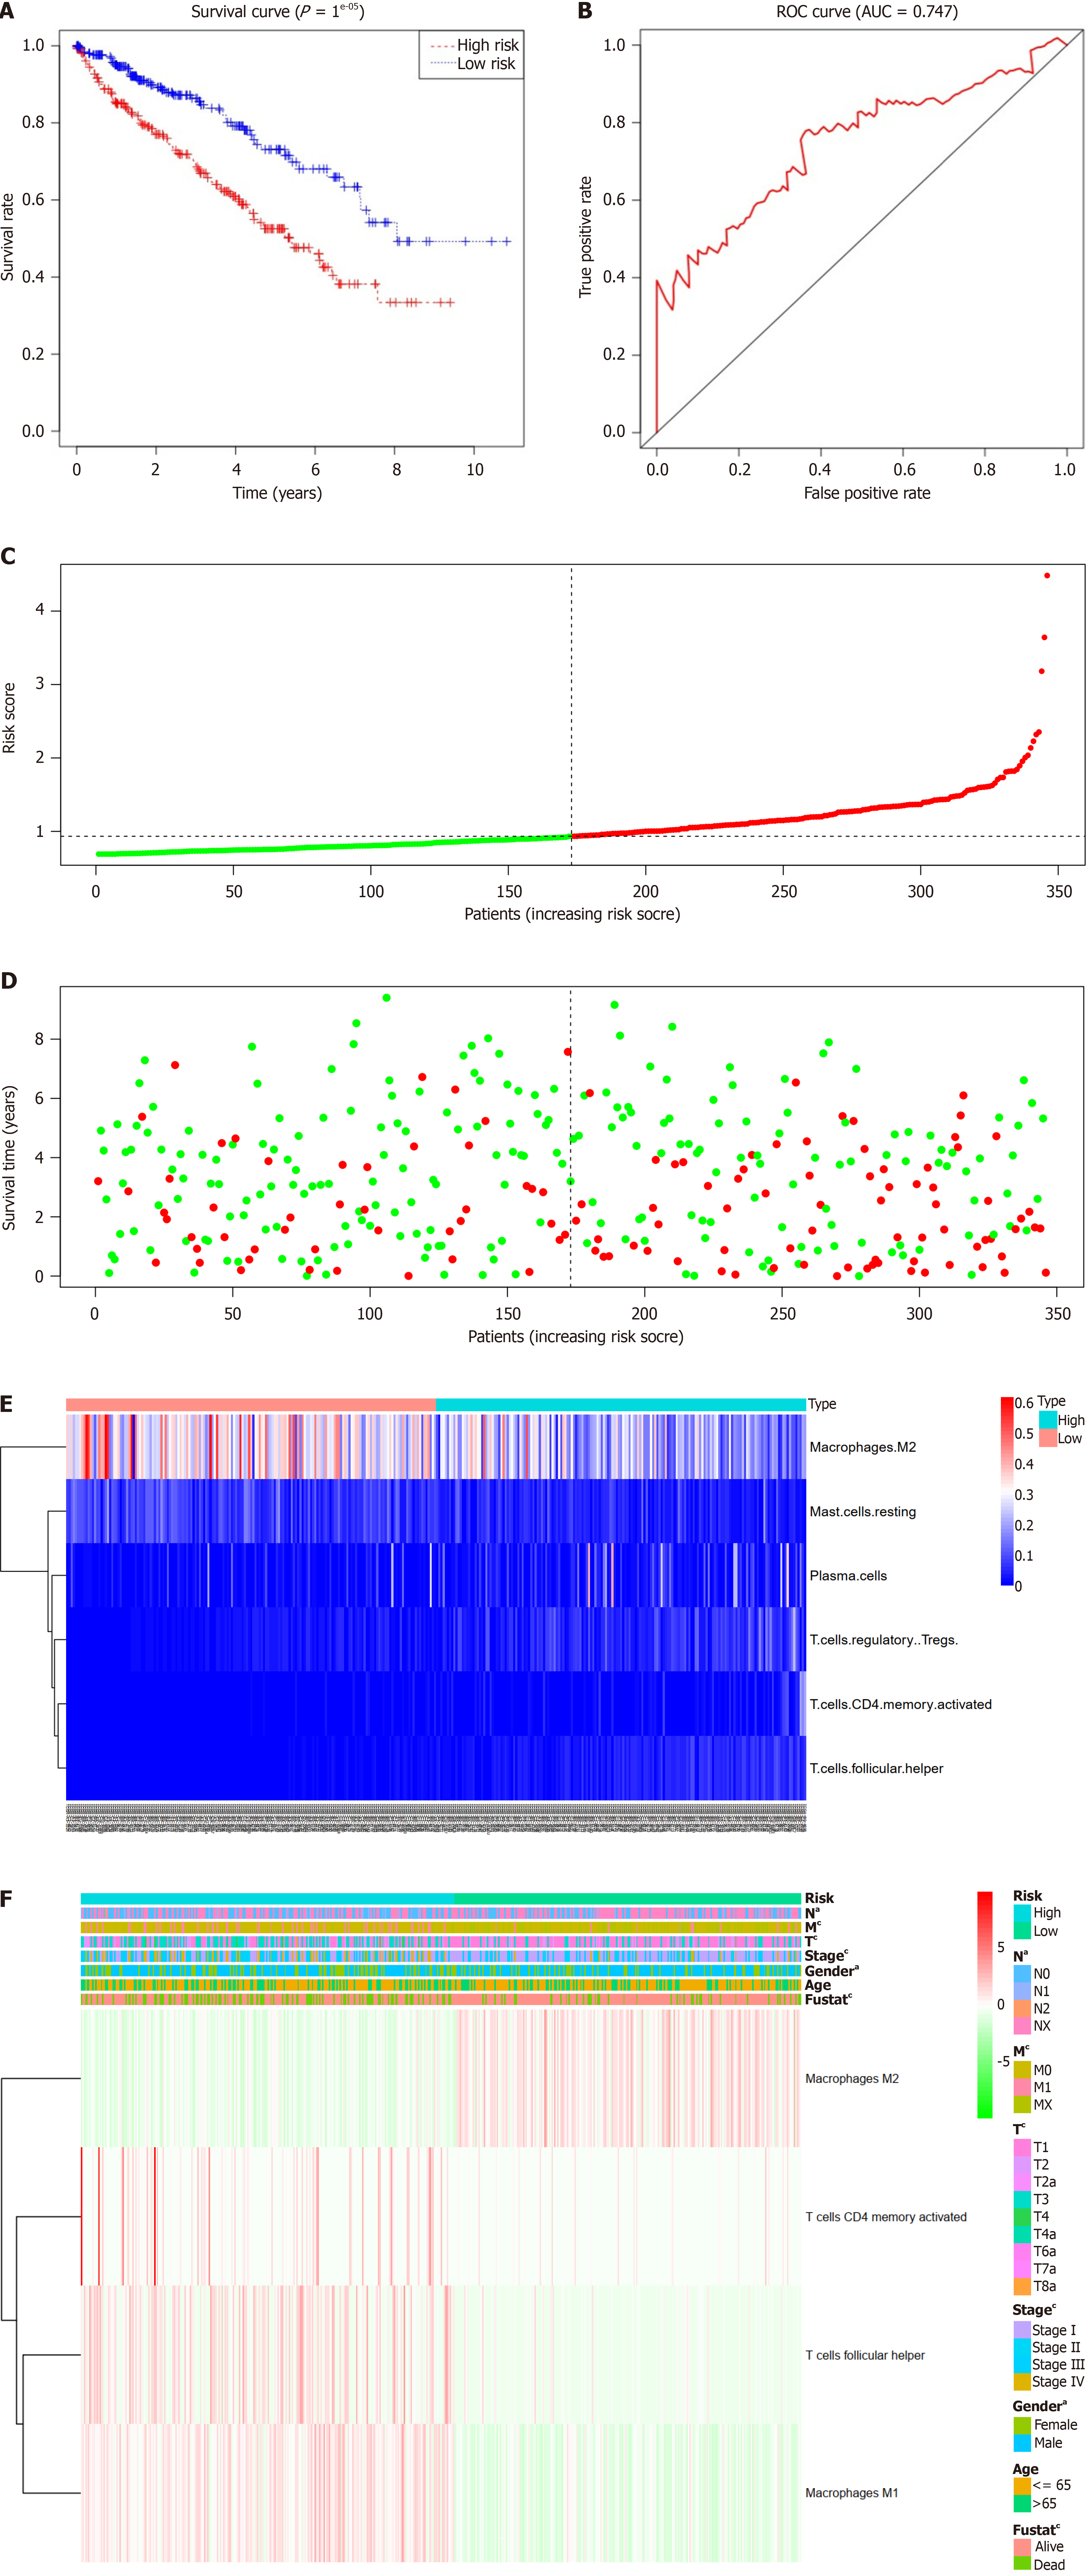
Figure 3 Univariate Cox regression analysis for factors affecting overall survival.
A: Kaplan-Meier survival curve of overall survival between the high-risk and low-risk groups; B: Receiver operating characteristic (ROC) curve area under the curve (AUC) statistics assess the predictive capability of the immune risk score model; C: Distribution of the immune risk score in renal cell carcinoma (RCC) patients; D: Distribution of the survival status of RCC patients; E: Distribution of five immune cells in the high-risk and low-risk groups; F: Correlation between the immune risk score and clinical indicators.
- Citation: Wei GH, Wei XY, Fan LY, Zhou WZ, Sun M, Zhu CD. Comprehensive assessment of the association between tumor-infiltrating immune cells and the prognosis of renal cell carcinoma. World J Clin Oncol 2024; 15(10): 1280-1292
- URL: https://www.wjgnet.com/2218-4333/full/v15/i10/1280.htm
- DOI: https://dx.doi.org/10.5306/wjco.v15.i10.1280


