Copyright
©The Author(s) 2024.
World J Clin Oncol. Jan 24, 2024; 15(1): 62-88
Published online Jan 24, 2024. doi: 10.5306/wjco.v15.i1.62
Published online Jan 24, 2024. doi: 10.5306/wjco.v15.i1.62
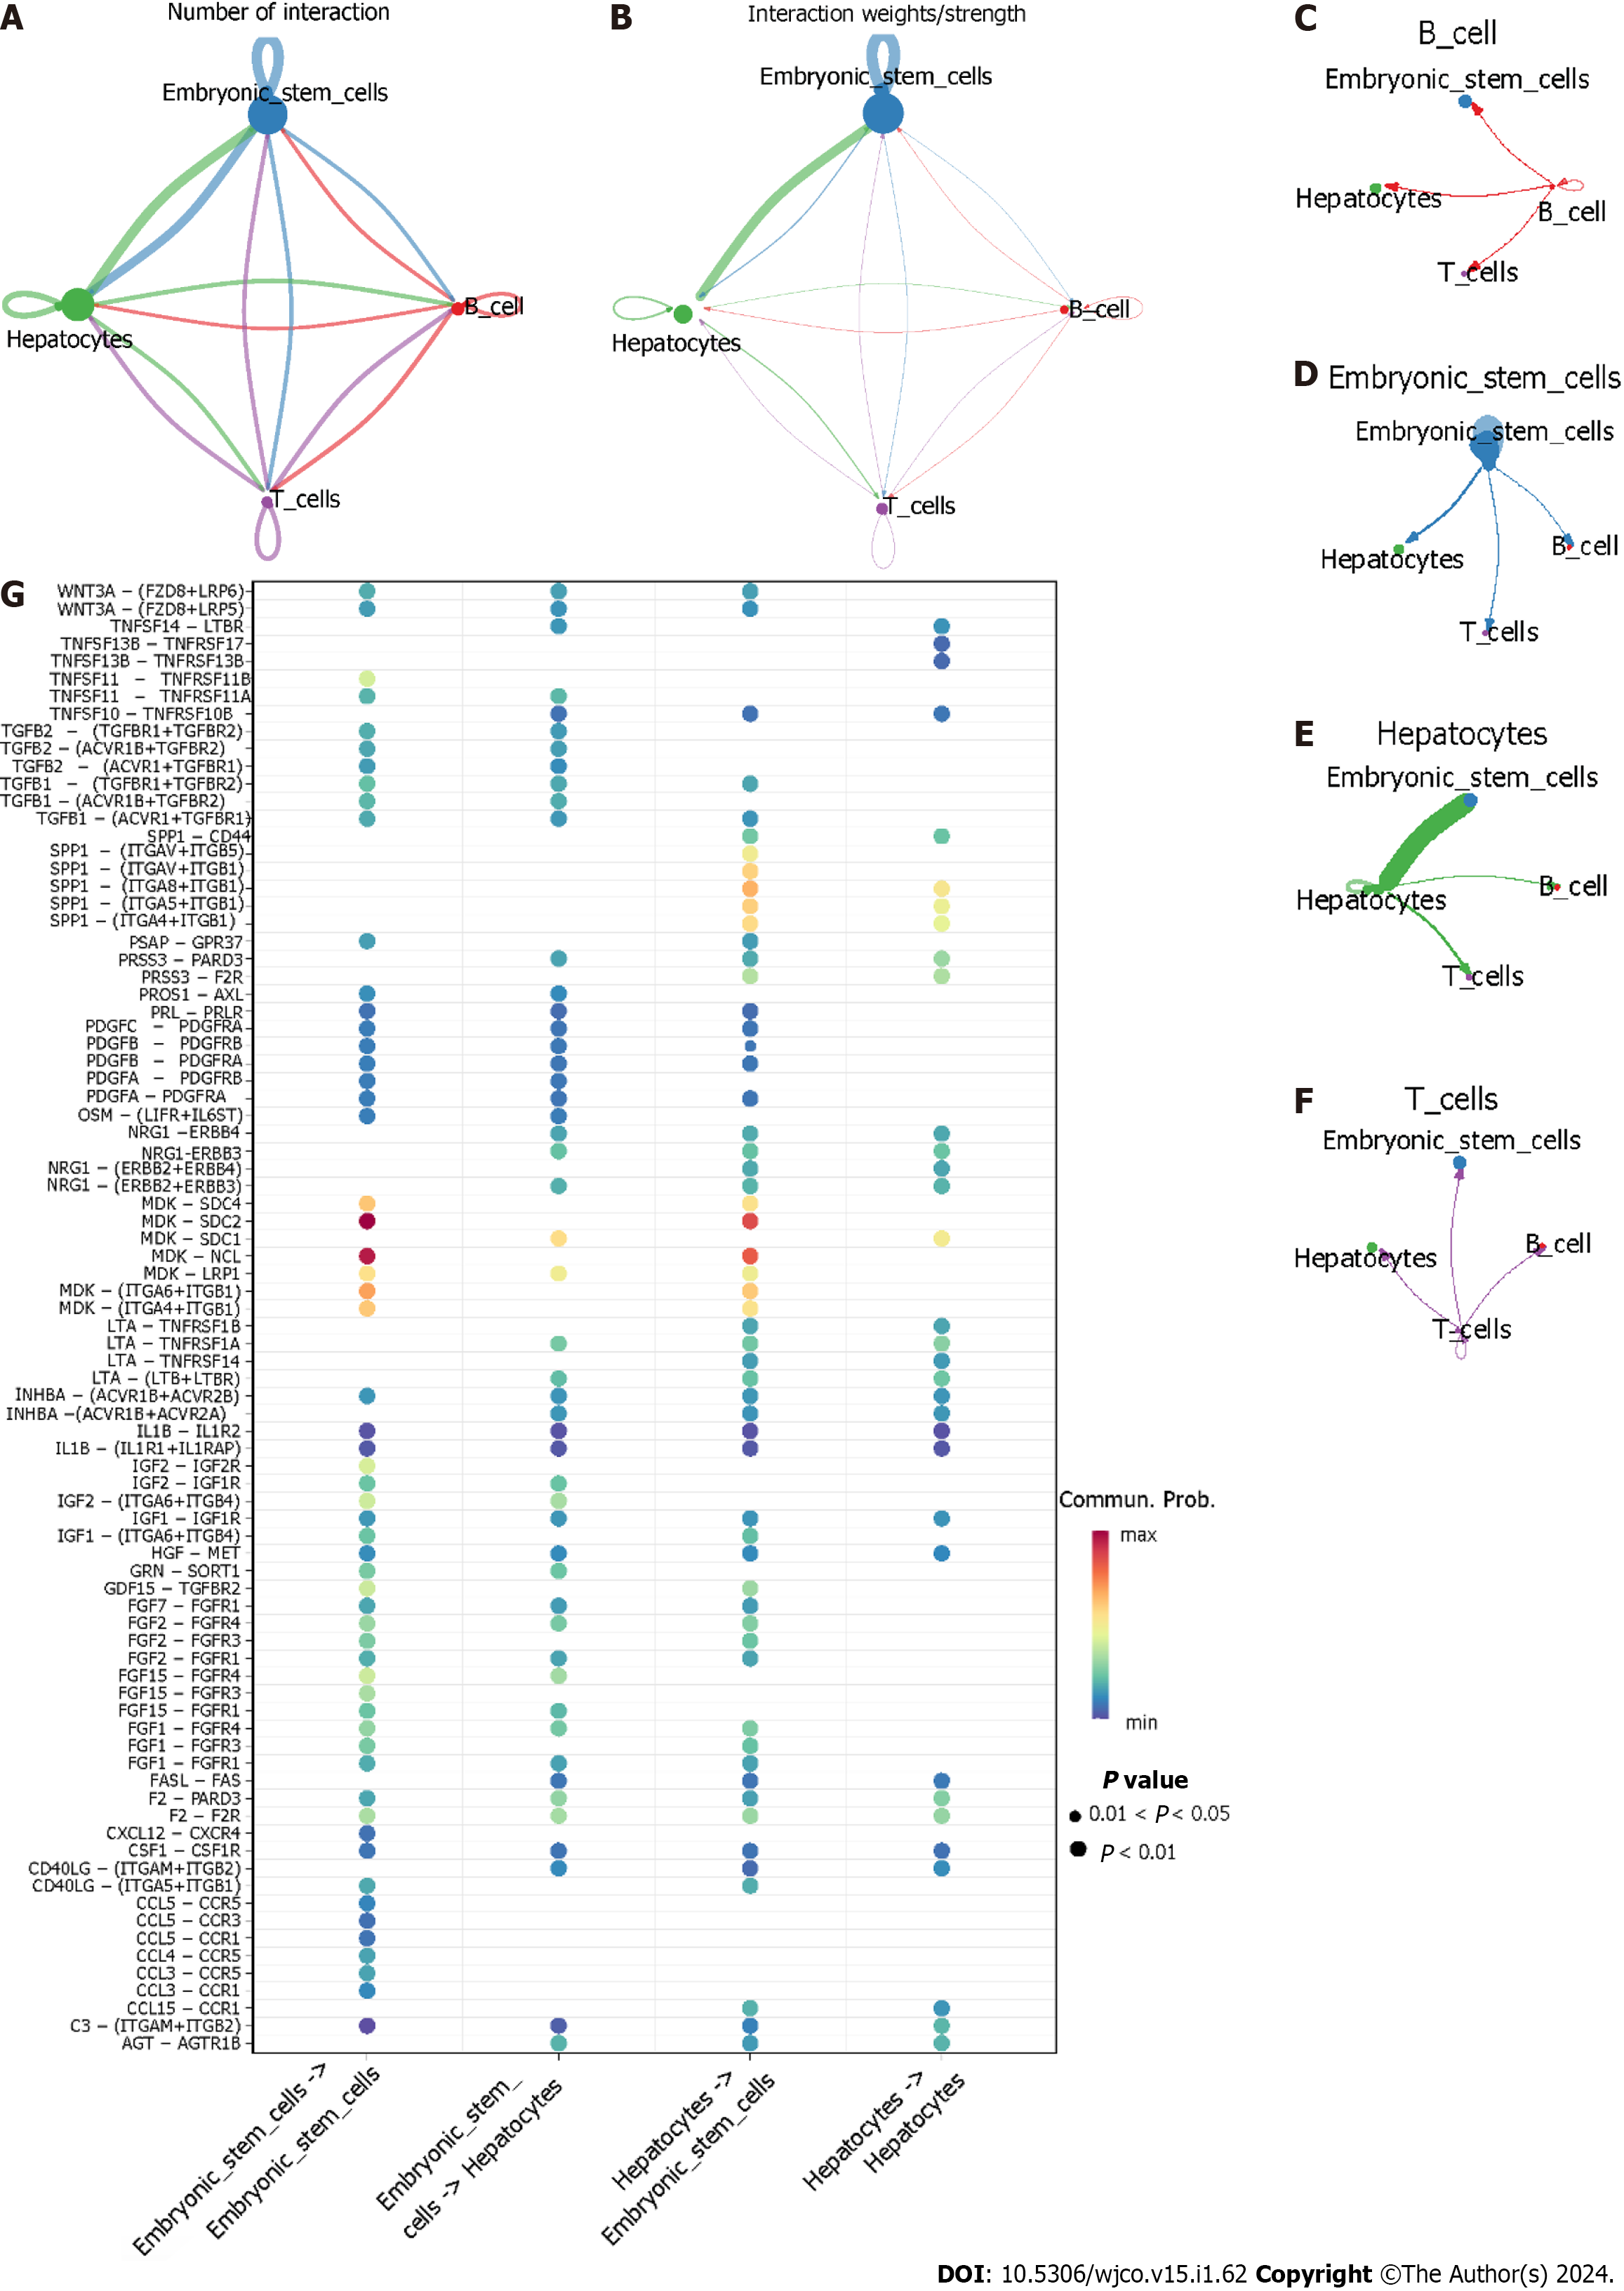
Figure 12 Cell–cell communication.
A and B: The aggregated intercellular communication between any two cell groups. The colours of the periphery circle referred to one cell group and the vertex of periphery circle represented the numbers of cells. The cells in the starting site of edge expressed ligand and the cells the arrow pointed in expressed receptor. The thickness of the line signified the numbers of ligand-receptor pairs, and the thicker the line meant more ligand-receptor pairs; B: The thickness of edge represented the interaction strength of any two cell groups. The thicker the edge was, the bigger the interaction strength; C–F: The intercellular communication of each cell group. Hepatocytes providing ligands had strongest communication with embryonic stem cells that expressed receptors; G: The identification of ligand-receptor pairs between hepatocytes and embryonic stem cells. (Ligands provider)→(receptors provider).
- Citation: Huang JZ, Li JD, Chen G, He RQ. Identification of the key genes and mechanisms associated with transcatheter arterial chemoembolisation refractoriness in hepatocellular carcinoma. World J Clin Oncol 2024; 15(1): 62-88
- URL: https://www.wjgnet.com/2218-4333/full/v15/i1/62.htm
- DOI: https://dx.doi.org/10.5306/wjco.v15.i1.62


