Copyright
©The Author(s) 2024.
World J Clin Oncol. Jan 24, 2024; 15(1): 62-88
Published online Jan 24, 2024. doi: 10.5306/wjco.v15.i1.62
Published online Jan 24, 2024. doi: 10.5306/wjco.v15.i1.62
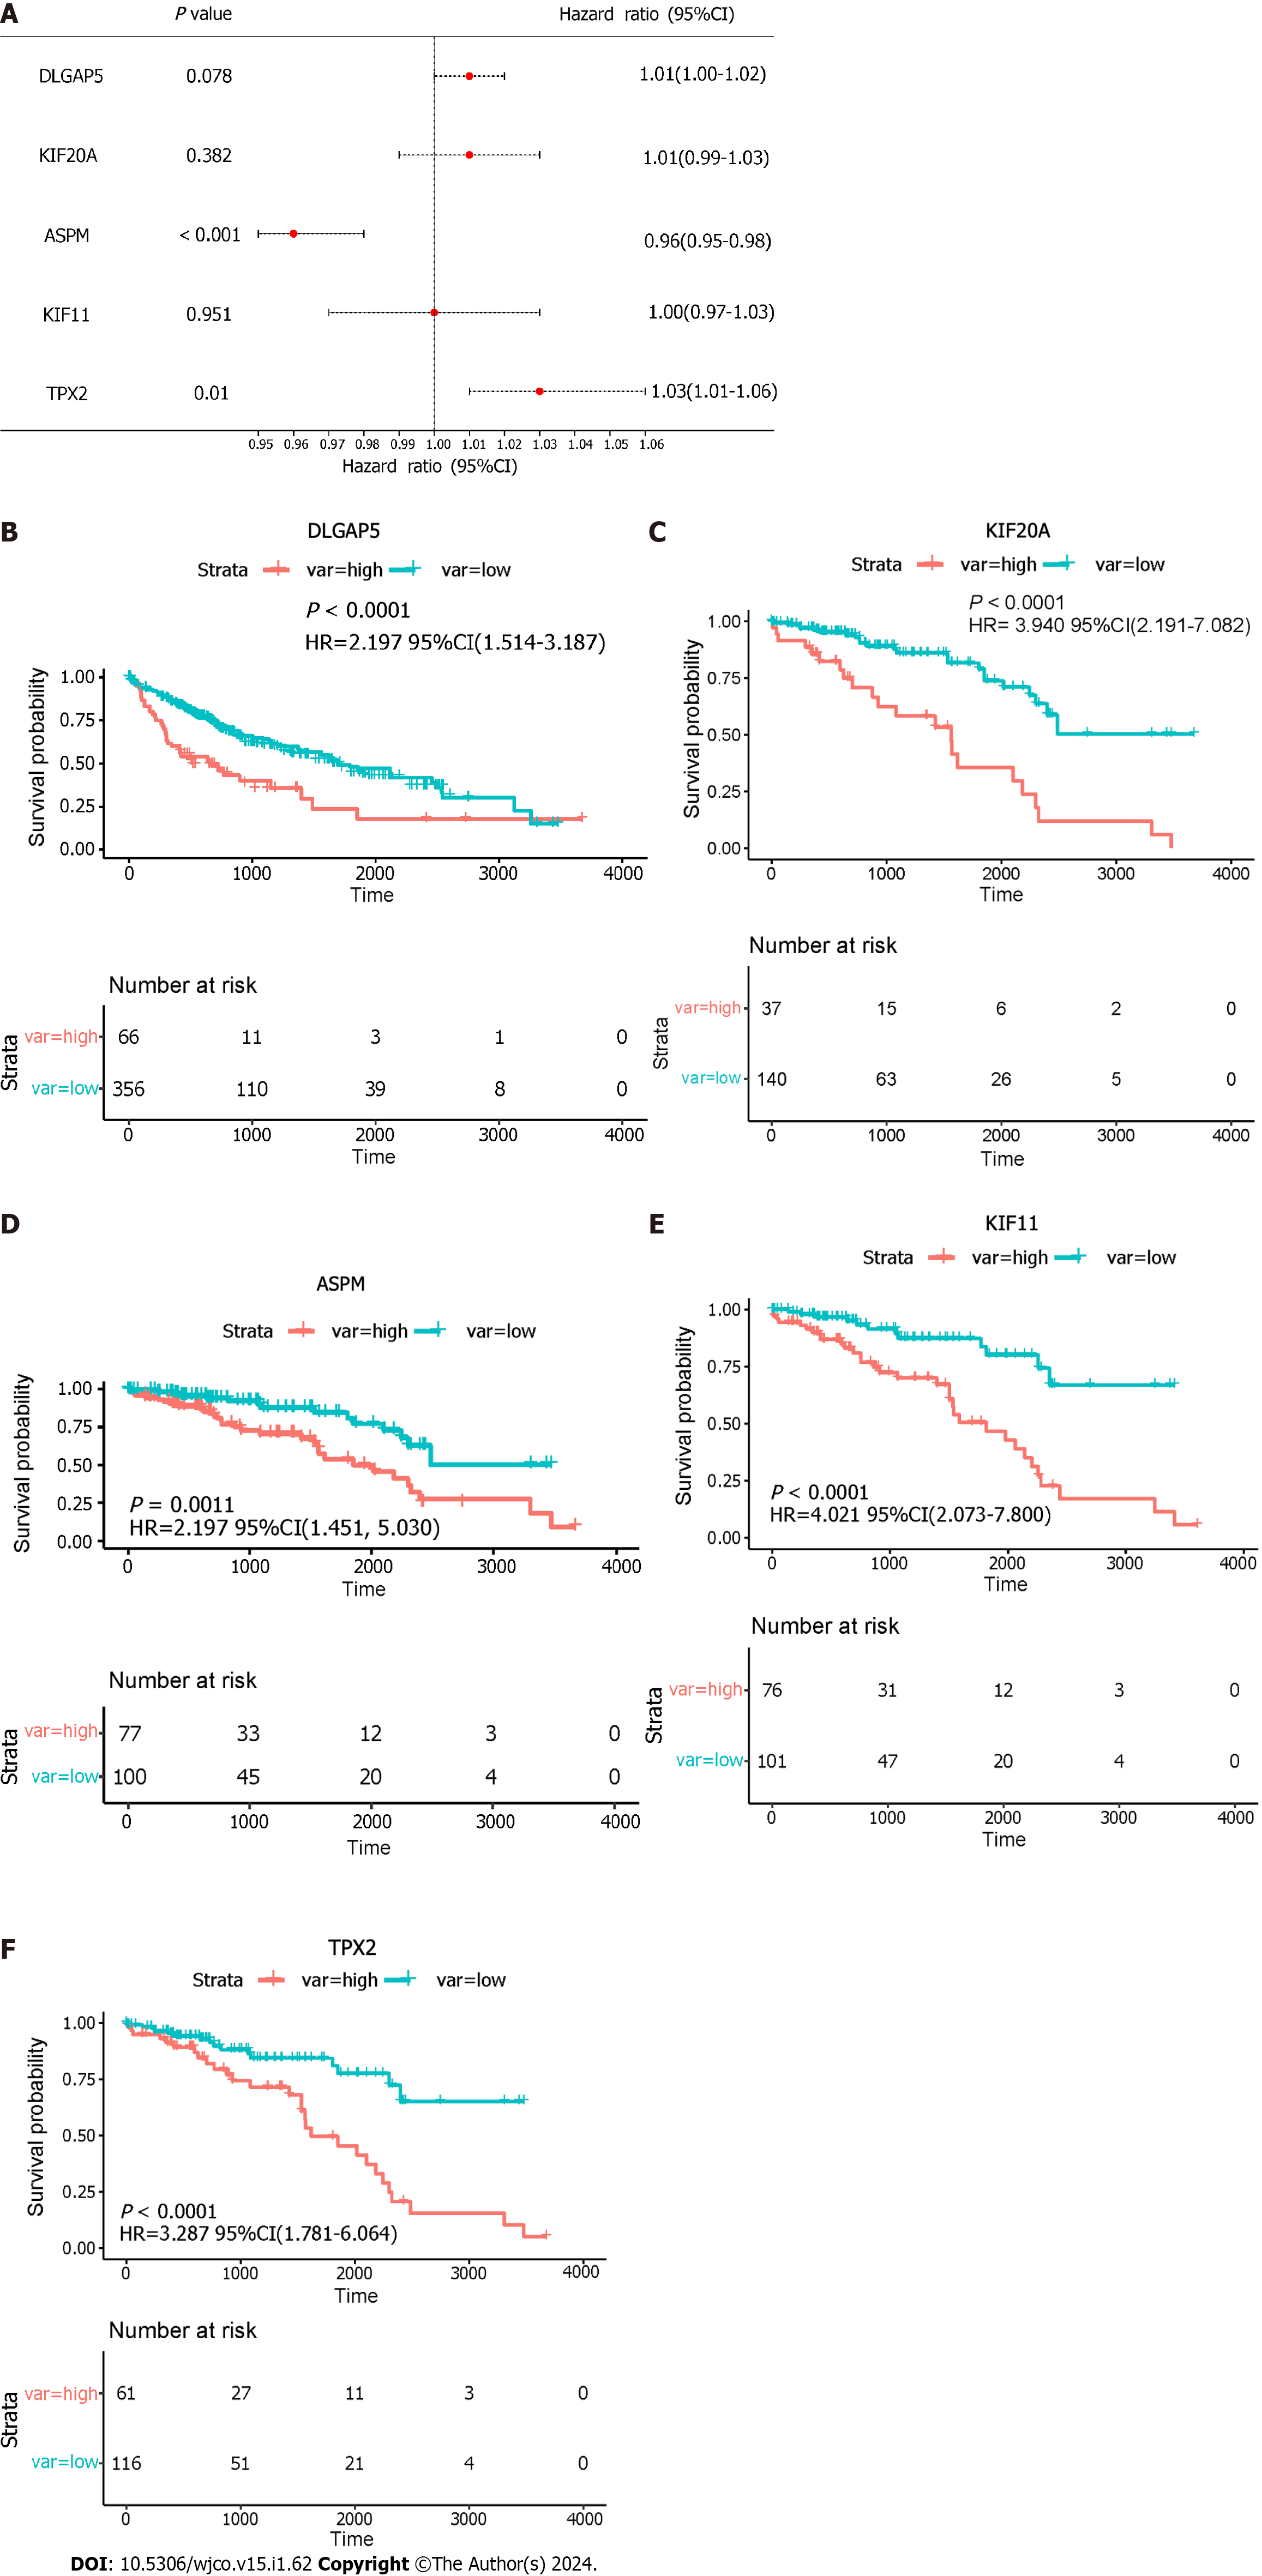
Figure 9 The Kaplan-Meier curve analysis.
A: The multivariate analysis of five key genes; B–F: Survival curves for the five key genes. DLGAP5: DLG associated protein 5; KIF20A: kinesin family member 20A; ASPM: Assembly factor for spindle microtubules; KIF11: Kinesin family member 11; TPX2: TPX2 microtubule nucleation factor; HR: Hazard ratio; CI: Confidence interval.
- Citation: Huang JZ, Li JD, Chen G, He RQ. Identification of the key genes and mechanisms associated with transcatheter arterial chemoembolisation refractoriness in hepatocellular carcinoma. World J Clin Oncol 2024; 15(1): 62-88
- URL: https://www.wjgnet.com/2218-4333/full/v15/i1/62.htm
- DOI: https://dx.doi.org/10.5306/wjco.v15.i1.62


