Copyright
©The Author(s) 2023.
World J Clin Oncol. Nov 24, 2023; 14(11): 518-534
Published online Nov 24, 2023. doi: 10.5306/wjco.v14.i11.518
Published online Nov 24, 2023. doi: 10.5306/wjco.v14.i11.518
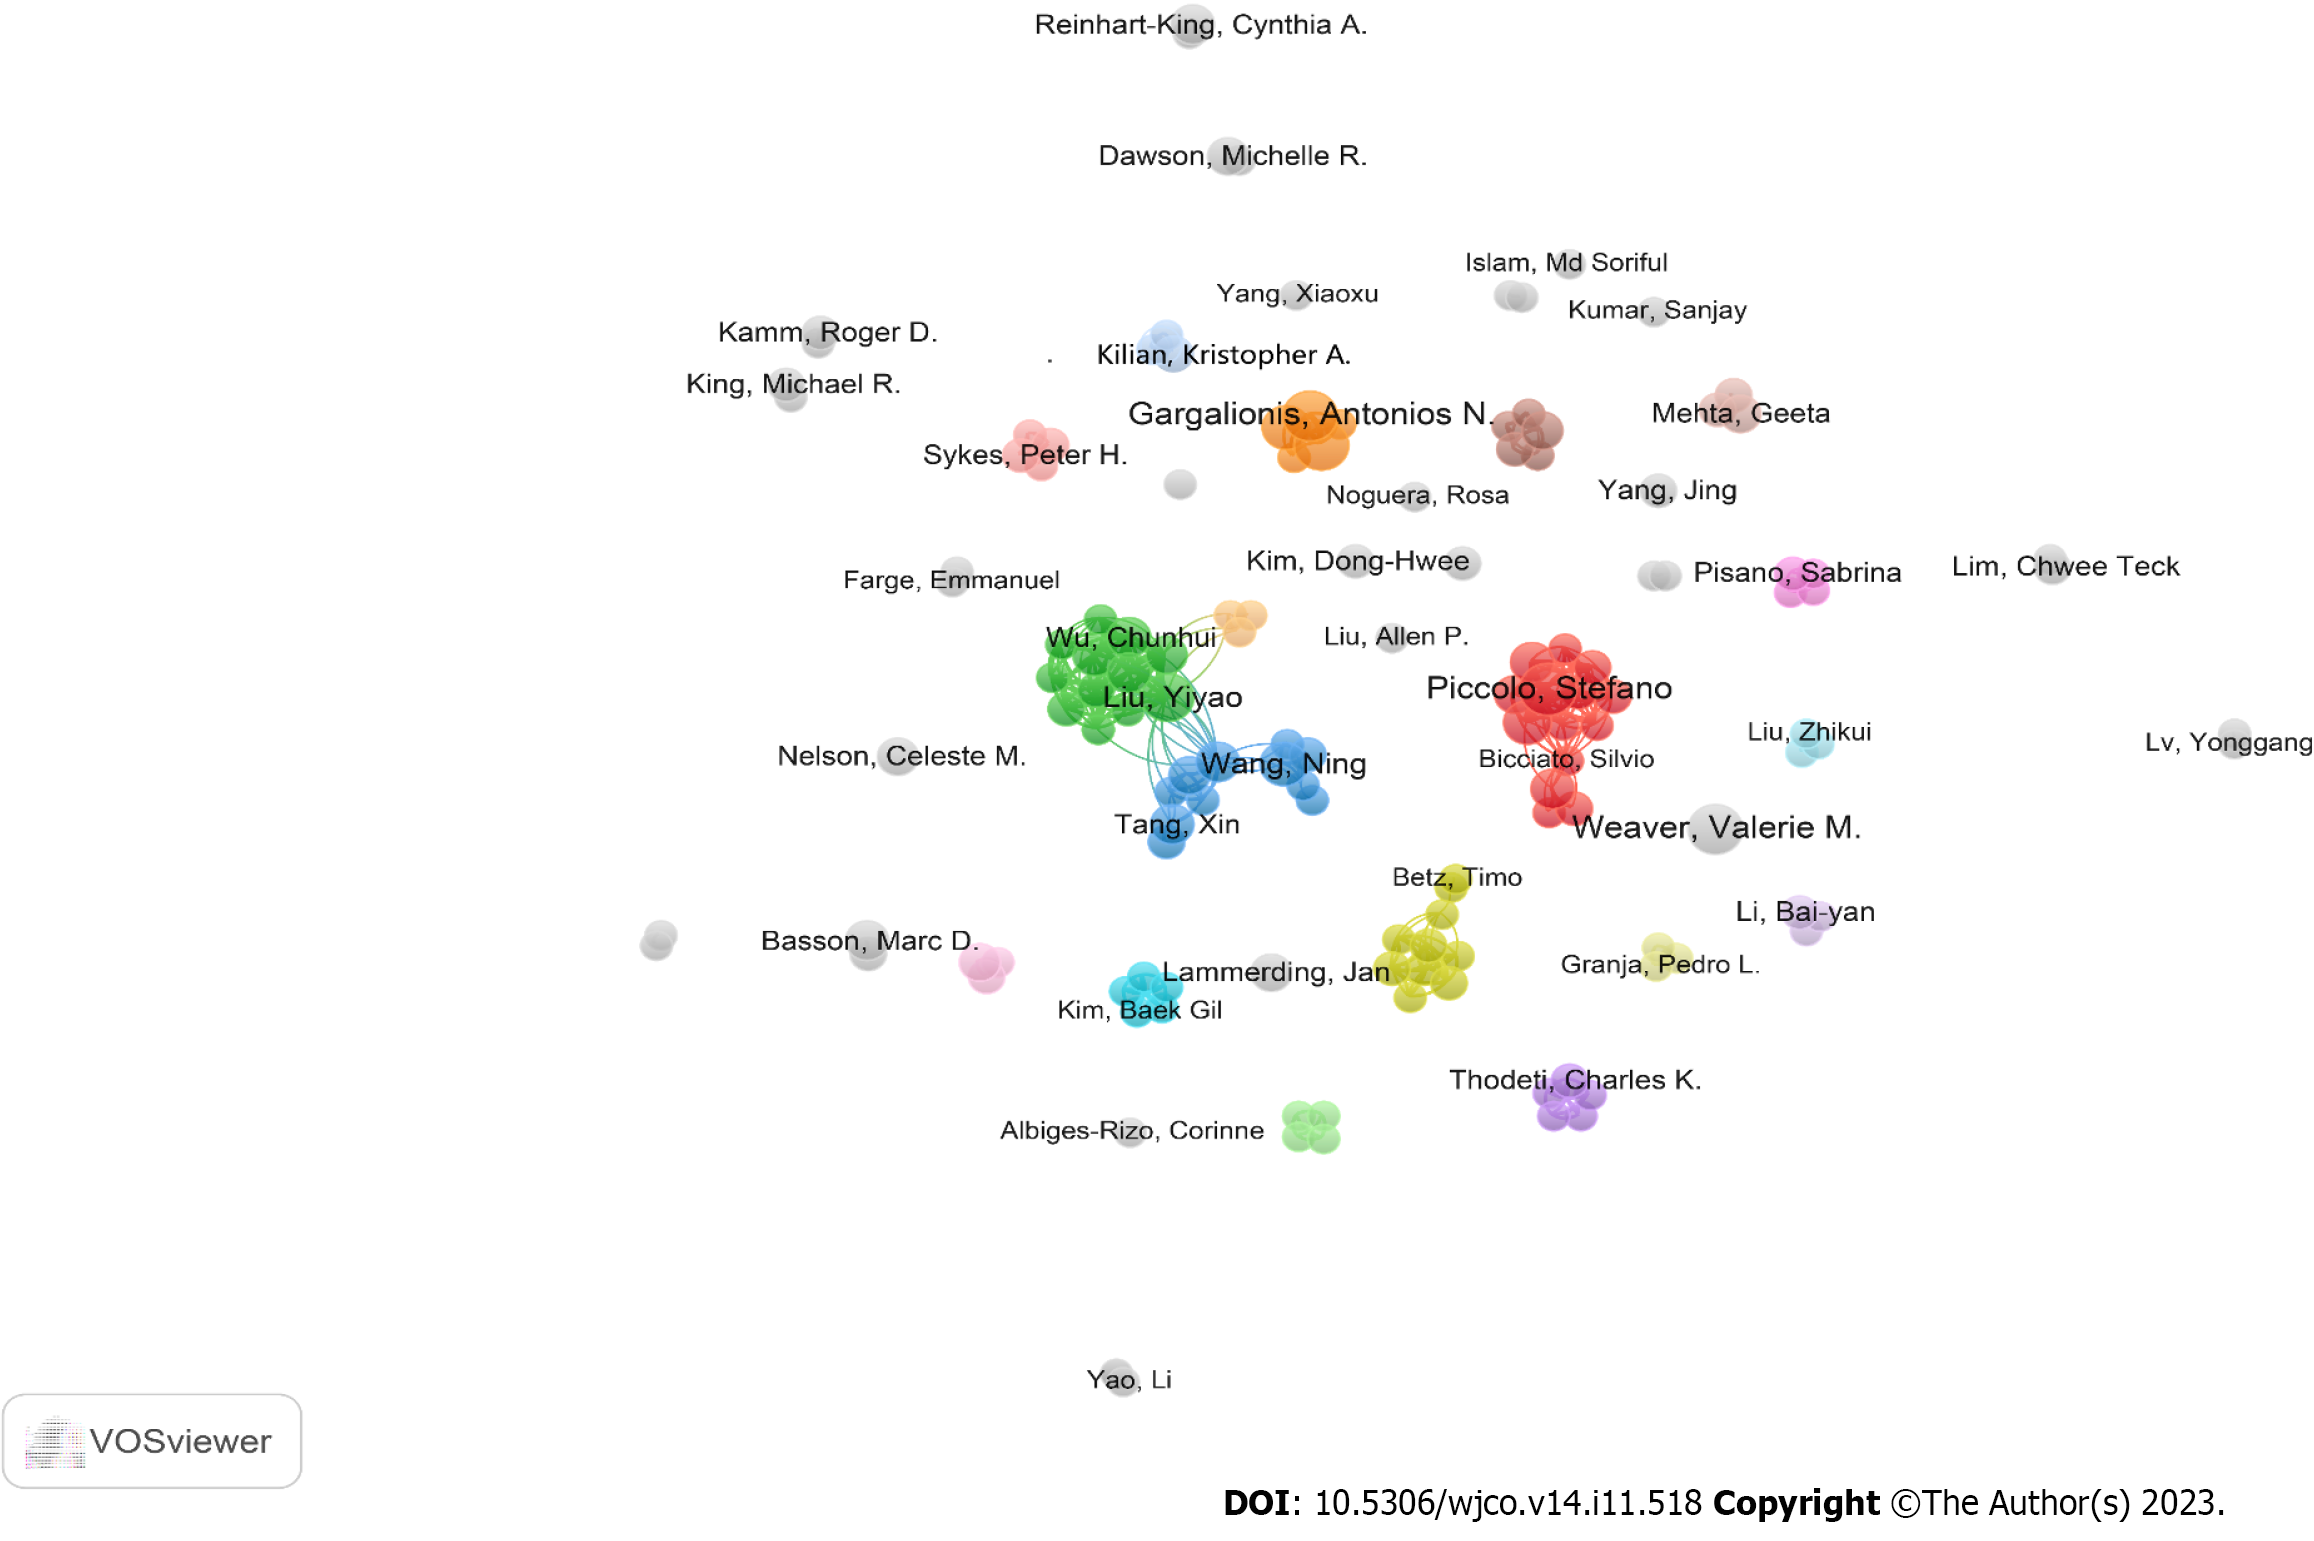
Figure 5 Visualization of author cooperation.
VOSviewer was used to visualize the co-authorship network. The clusters are indicated by the different colors and the lines represent the various collaborations between authors.
- Citation: Zhang YZ, Li MZ, Wang GX, Wang DW. Bibliometric analysis of the global research status and trends of mechanotransduction in cancer. World J Clin Oncol 2023; 14(11): 518-534
- URL: https://www.wjgnet.com/2218-4333/full/v14/i11/518.htm
- DOI: https://dx.doi.org/10.5306/wjco.v14.i11.518


