Copyright
©The Author(s) 2022.
World J Clin Oncol. Jul 24, 2022; 13(7): 616-629
Published online Jul 24, 2022. doi: 10.5306/wjco.v13.i7.616
Published online Jul 24, 2022. doi: 10.5306/wjco.v13.i7.616
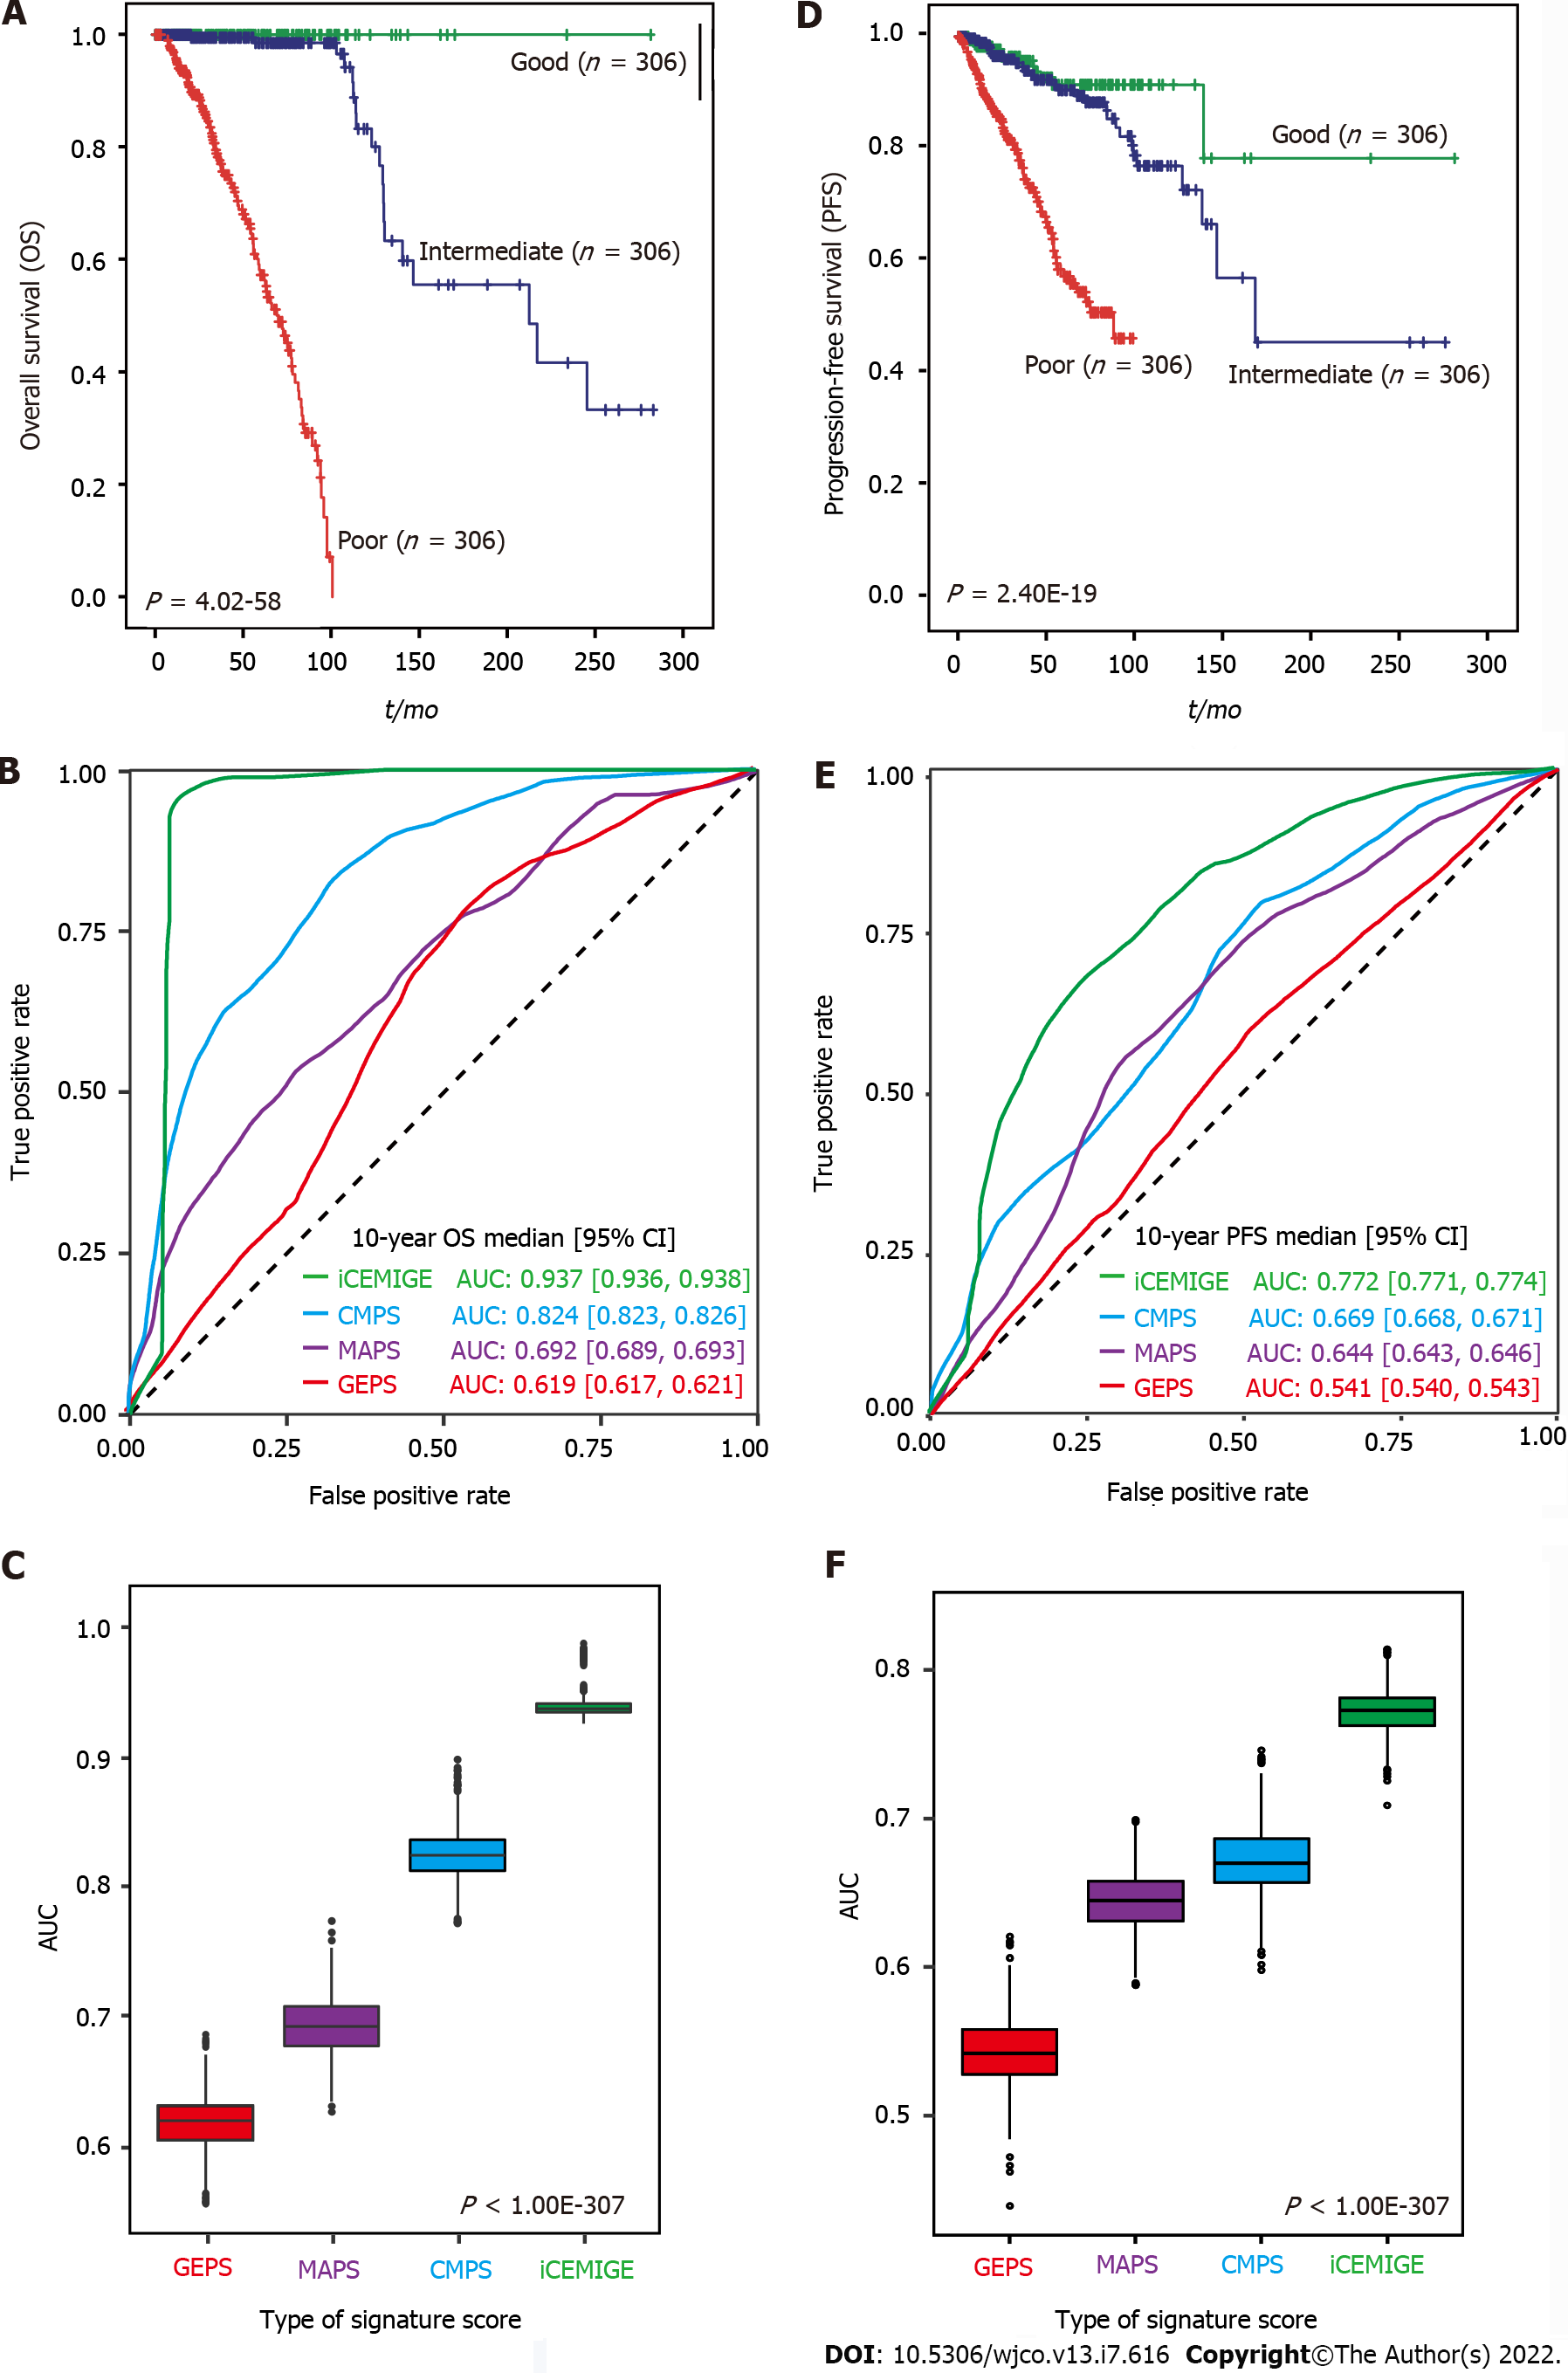
Figure 3 iCEMIGE significantly outperforms cellular morphometric prognosis score, 15-microbe abundance prognosis score, and cellular morphometric prognosis score in prognosis prediction in the Cancer Genome Atlas breast cancer cohort.
A: Kaplan-Meier overall survival (OS) curves for breast cancer (BC) patients are presented according to iCEMIGE score groups; B: ROC curves for 10-year OS prediction across different signature scores. C: Area under the curve (AUC) of 10-year OS prediction across different signature scores; D: Kaplan-Meier progress-free survival (PFS) curves for BC patients are presented according to iCEMIGE score groups; E: Receiver operating characteristic (ROC) curves for 10-year PFS prediction across different signature scores. F: AUC of 10-year PFS prediction across different signature scores. The Kaplan-Meier p-values were calculated by the log-rank test among the three groups. The P values for AUC were obtained from Kruskal-Wallis test.
- Citation: Mao XY, Perez-Losada J, Abad M, Rodríguez-González M, Rodríguez CA, Mao JH, Chang H. iCEMIGE: Integration of CEll-morphometrics, MIcrobiome, and GEne biomarker signatures for risk stratification in breast cancers. World J Clin Oncol 2022; 13(7): 616-629
- URL: https://www.wjgnet.com/2218-4333/full/v13/i7/616.htm
- DOI: https://dx.doi.org/10.5306/wjco.v13.i7.616


