Copyright
©The Author(s) 2021.
World J Clin Oncol. Jun 24, 2021; 12(6): 482-499
Published online Jun 24, 2021. doi: 10.5306/wjco.v12.i6.482
Published online Jun 24, 2021. doi: 10.5306/wjco.v12.i6.482
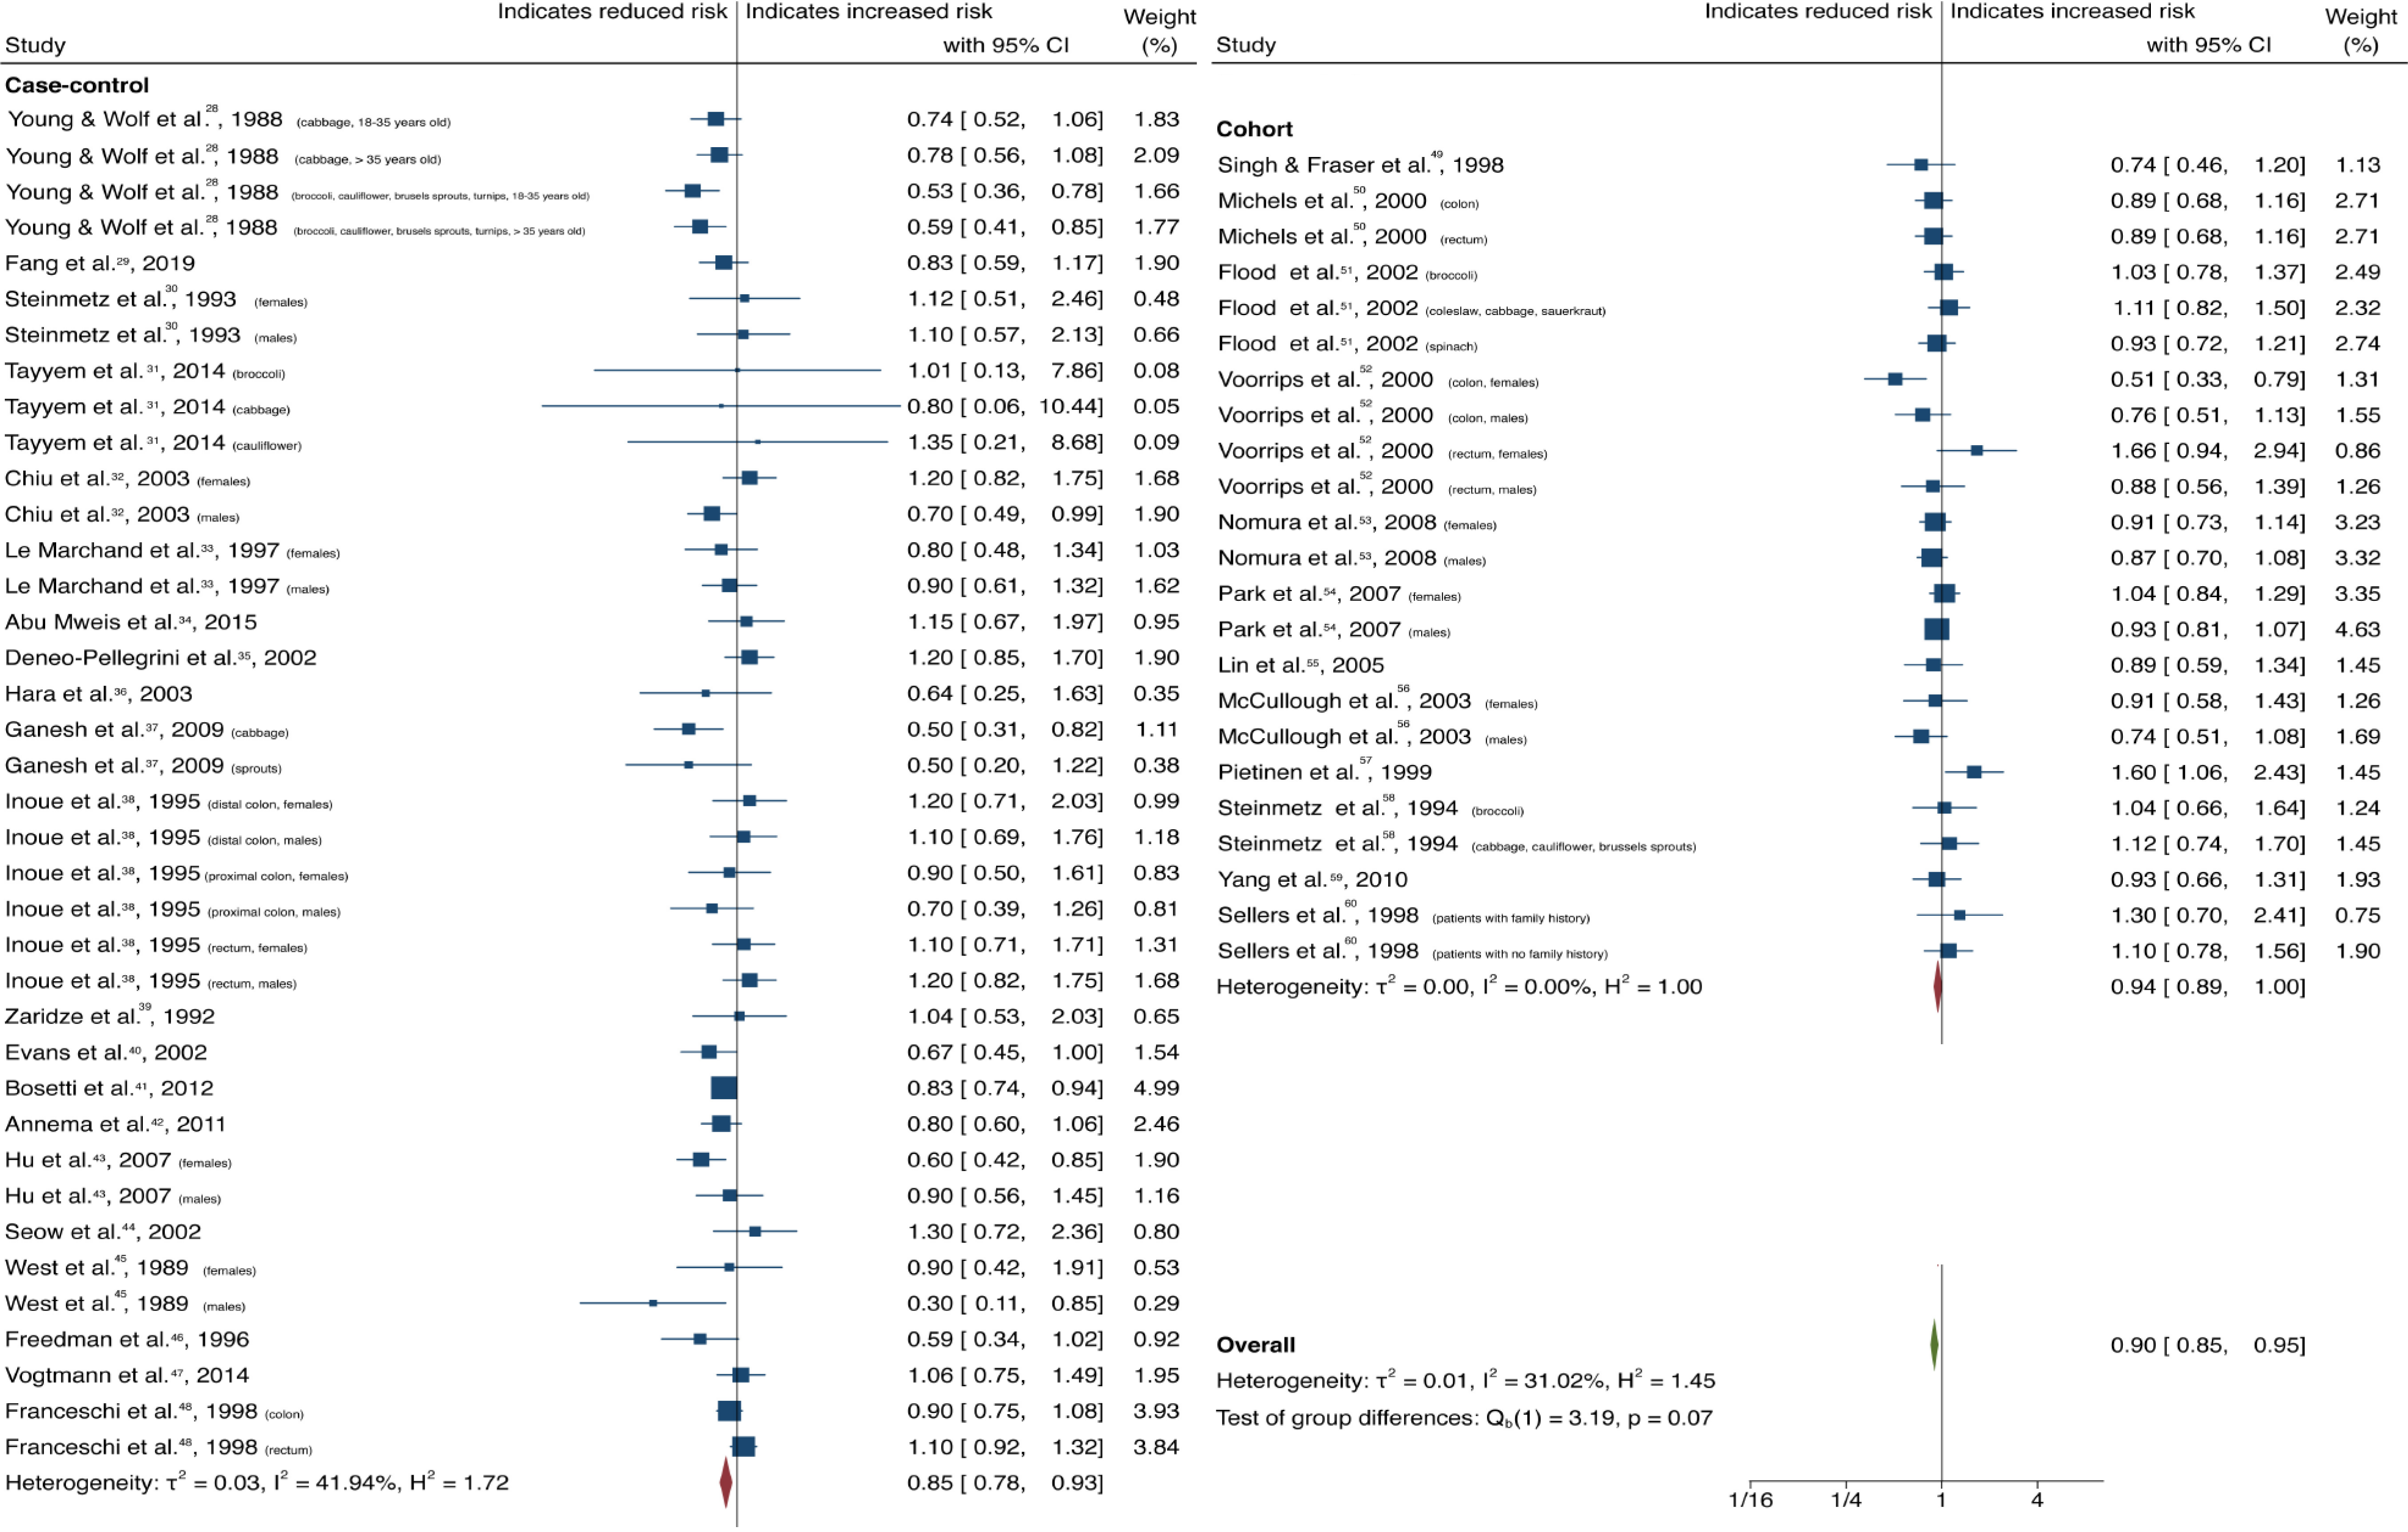
Figure 2 Forest plot showing the association between dietary cruciferous vegetable consumption and colorectal cancer risk.
Squares and horizontal lines represent study-specific odds ratios (ORs) and 95% confidence intervals (CIs). The size of each square indicates the weighting of the study in the overall analysis depending on population size. Diamonds represent pooled ORs of all studies of that food item and 95%CI of the overall population. Vertical line indicates OR 1.0. CI: Confidence interval.
- Citation: Borgas P, Gonzalez G, Veselkov K, Mirnezami R. Phytochemically rich dietary components and the risk of colorectal cancer: A systematic review and meta-analysis of observational studies. World J Clin Oncol 2021; 12(6): 482-499
- URL: https://www.wjgnet.com/2218-4333/full/v12/i6/482.htm
- DOI: https://dx.doi.org/10.5306/wjco.v12.i6.482


