Copyright
©The Author(s) 2020.
World J Clin Oncol. Sep 24, 2020; 11(9): 732-746
Published online Sep 24, 2020. doi: 10.5306/wjco.v11.i9.732
Published online Sep 24, 2020. doi: 10.5306/wjco.v11.i9.732
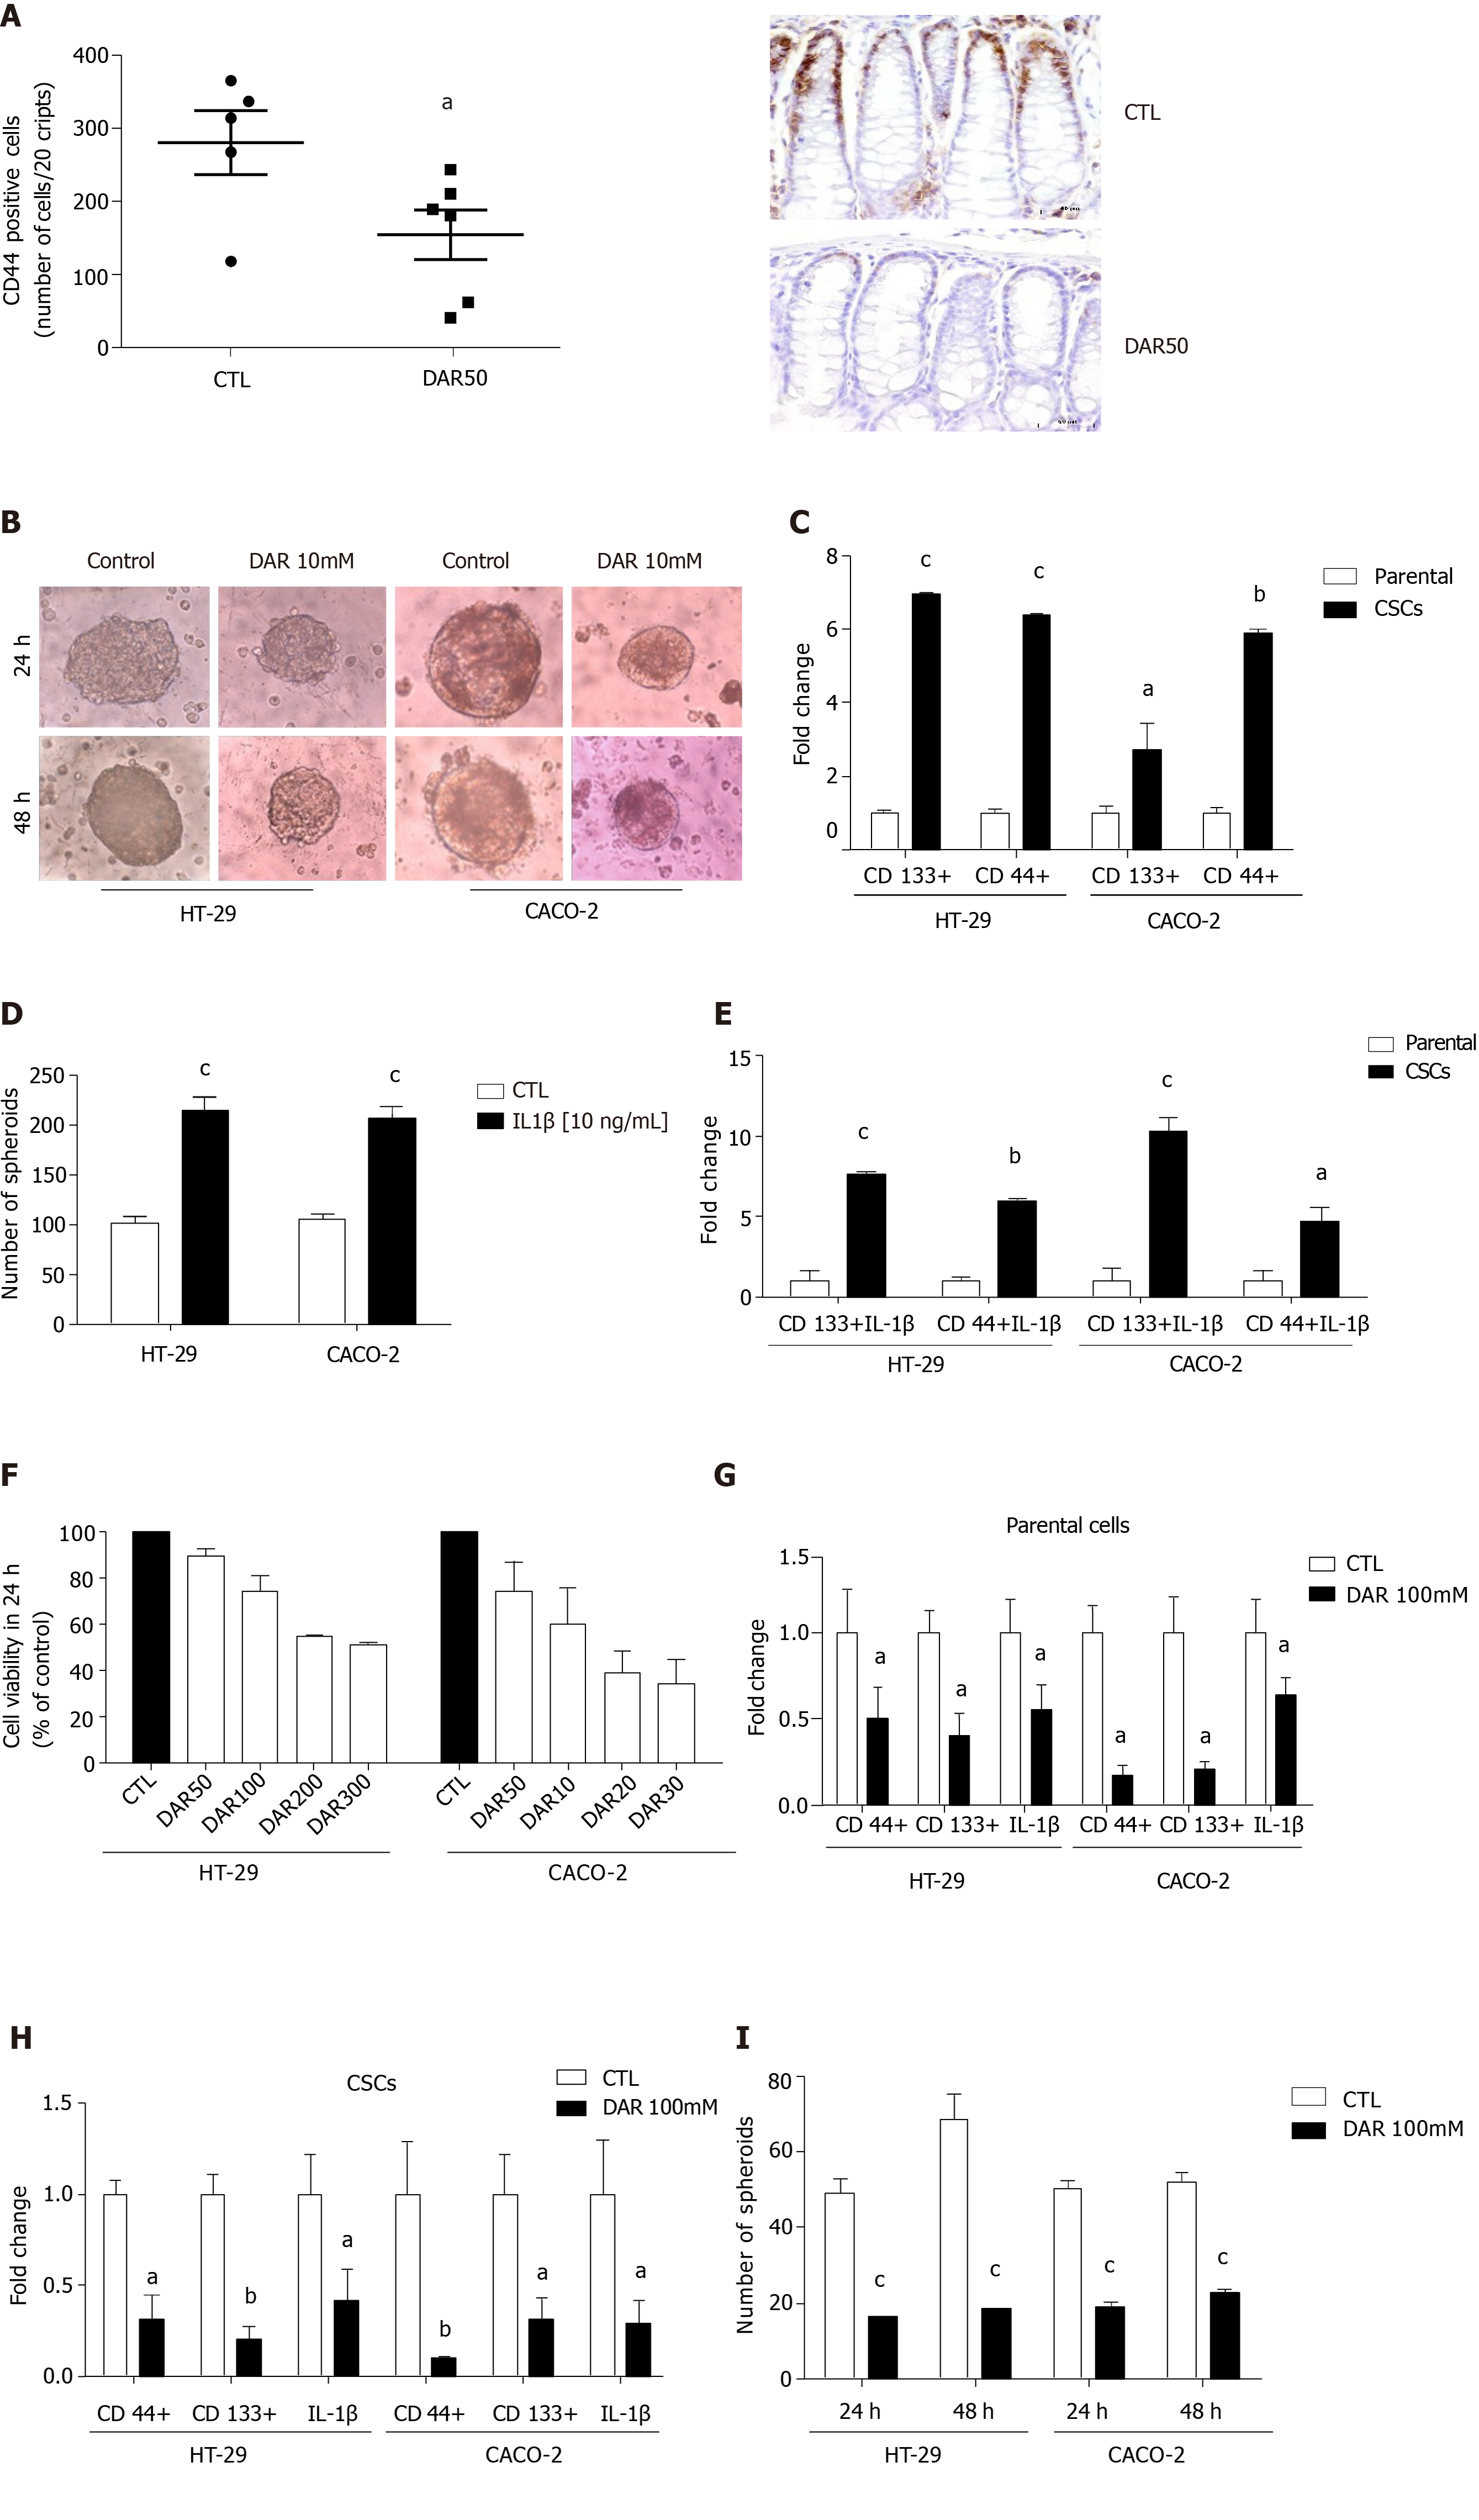
Figure 4 Diacerein effects on cancer stem cells.
A: Quantification of CD44 and representative microphotographs of stained colon sections (magnification 40 ×), scale bar: 50 µm; B: Representative images of cancer stem cells (CSCs) cultured in serum or stem-selective conditions with or without diacerein (DAR) 100 mM in HT-29 and CACO-2 cells; C: Quantitative reverse transcription polymerase chain reaction (RT-PCR) analysis of CSC markers CD133 and CD44 in parental cells and CSCs (n = 3) in HT-29 and CACO-2 cells; D: Number of spheres in HT-29 and CACO-2 cells after treatment with interleukin (IL)-1β (10 ng/mL) for 24 h (n = 8); E: Quantitative RT-PCR analysis of CD44 and CD133 in parental cells and CSCs; Parental: cells cultivated with Dulbecco’s modified Eagle’s medium (DMEM) + IL-1β (10 ng/mL); CSCs: cells cultivated with DMEM + IL-1β (10 ng/mL, n = 3); F: Cell viability evaluated through MTT assay. Control: Cells cultivated with DMEM; DAR 50 mM, 100 mM, 200 mM and 300 mM: Cells cultivated with DMEM + DAR in different concentrations (n = 3); G: Quantitative RT-PCR analysis of CD44, CD133 and IL-1β in parental cells. Control: Cells cultivated with DMEM; DAR 100 mM: Cells cultivated with DMEM + DAR 100 mM (n = 3); H: Quantitative RT-PCR analysis of CD44, CD133 and IL-1β in CSCs. Control: Cells cultivated with DMEM; DAR 100 mM: Cells cultivated with DMEM + DAR 100 mM (n = 3); I: Number of spheres in HT-29 and CACO-2 cells after treatment with DAR 100 mM or vehicle after 24 h (n = 8) and 48 h (n = 8). Data are presented as mean ± standard error. aP < 0.05; bP < 0.01; cP < 0.001.
- Citation: Paulino DSM, Mendes MCS, Camargo JA, Brambilla SR, Wood Dos Santos T, Ribeiro ML, Carvalheira JBC. Diacerein treatment prevents colitis-associated cancer in mice. World J Clin Oncol 2020; 11(9): 732-746
- URL: https://www.wjgnet.com/2218-4333/full/v11/i9/732.htm
- DOI: https://dx.doi.org/10.5306/wjco.v11.i9.732


