Copyright
©The Author(s) 2020.
World J Clin Oncol. Sep 24, 2020; 11(9): 679-704
Published online Sep 24, 2020. doi: 10.5306/wjco.v11.i9.679
Published online Sep 24, 2020. doi: 10.5306/wjco.v11.i9.679
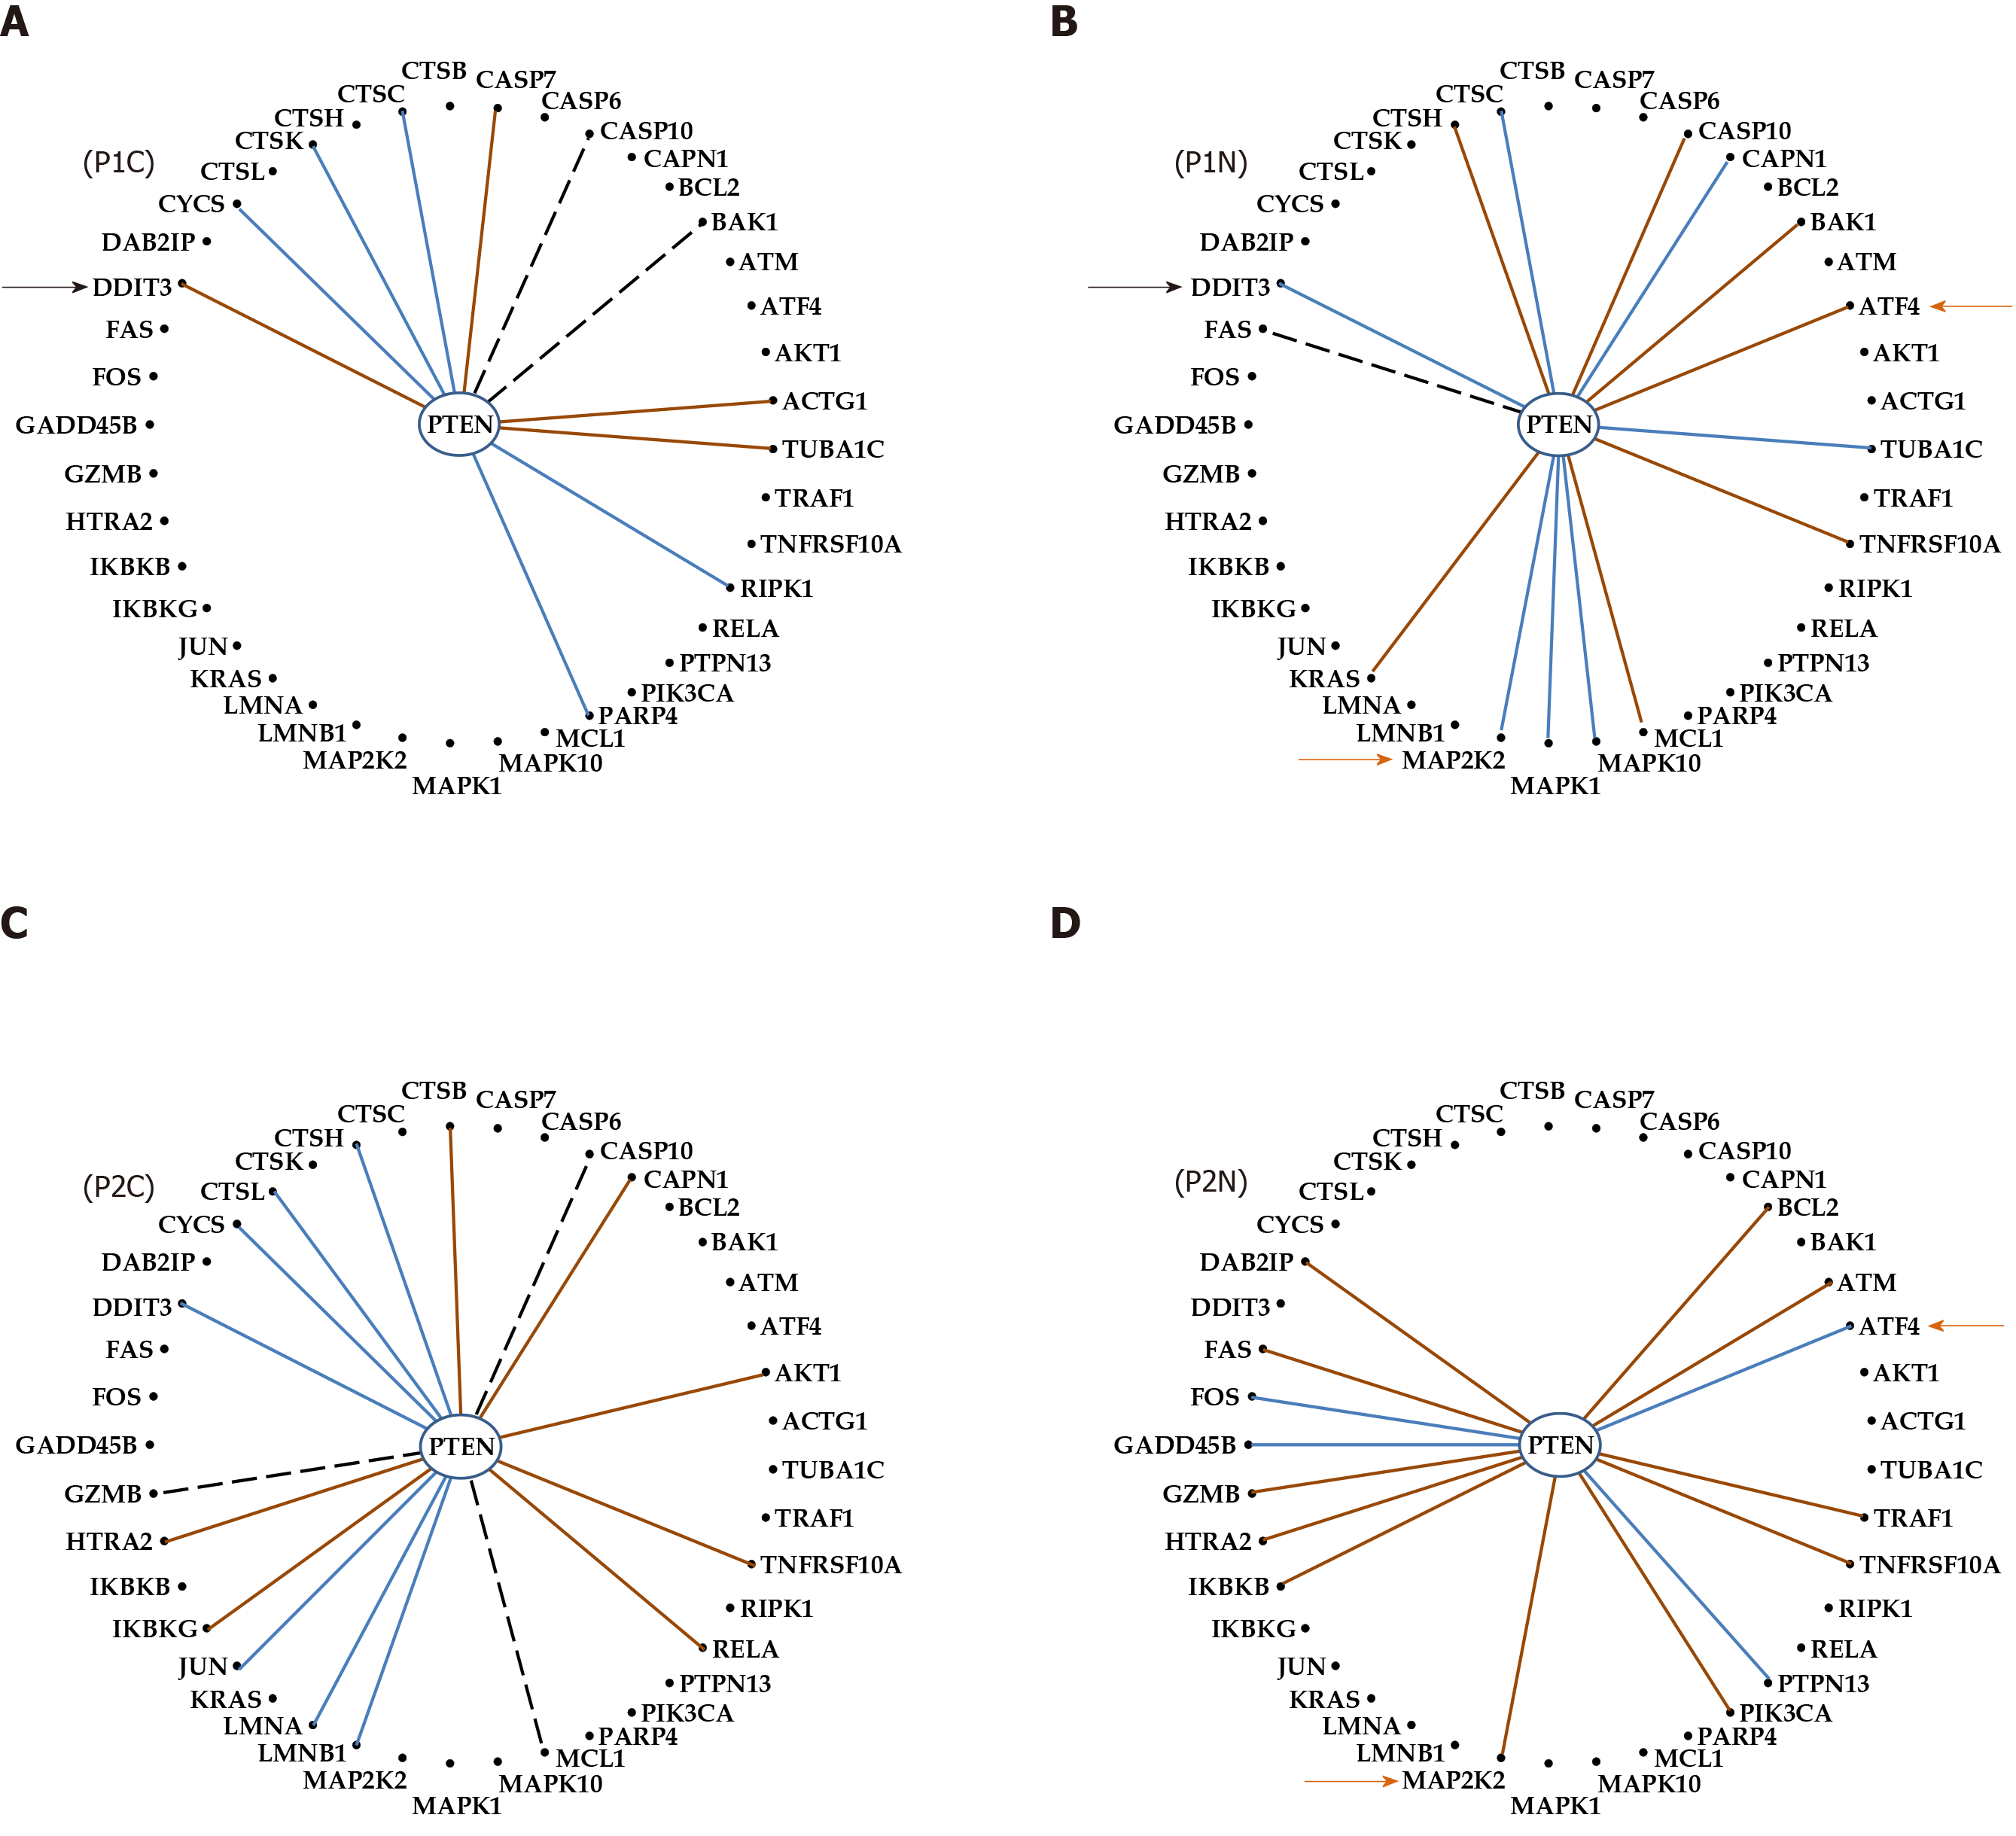
Figure 7 Even with the same phenotype and Gleason score, the genes are networked differently in the prostates of distinct persons.
A: Cancer of patient P1; B: Normal tissue of patient P1; C: Cancer of patient P2; D: Normal tissue of patient P2; Continuous brown/blue lines indicate statistically (P < 0.05) significant synergistic/antagonistic pairing of the connected genes, while dashed black ones that the two genes are independently expressed. Black arrows point to a gene whose coordination with PTEN was switched from negative in the normal tissue to positive in the corresponding cancer nodule. Brown arrows mark the opposite coordination when comparing the normal tissues of the two patients.
- Citation: Iacobas DA. Powerful quantifiers for cancer transcriptomics. World J Clin Oncol 2020; 11(9): 679-704
- URL: https://www.wjgnet.com/2218-4333/full/v11/i9/679.htm
- DOI: https://dx.doi.org/10.5306/wjco.v11.i9.679


