Copyright
©The Author(s) 2020.
World J Clin Oncol. Sep 24, 2020; 11(9): 679-704
Published online Sep 24, 2020. doi: 10.5306/wjco.v11.i9.679
Published online Sep 24, 2020. doi: 10.5306/wjco.v11.i9.679
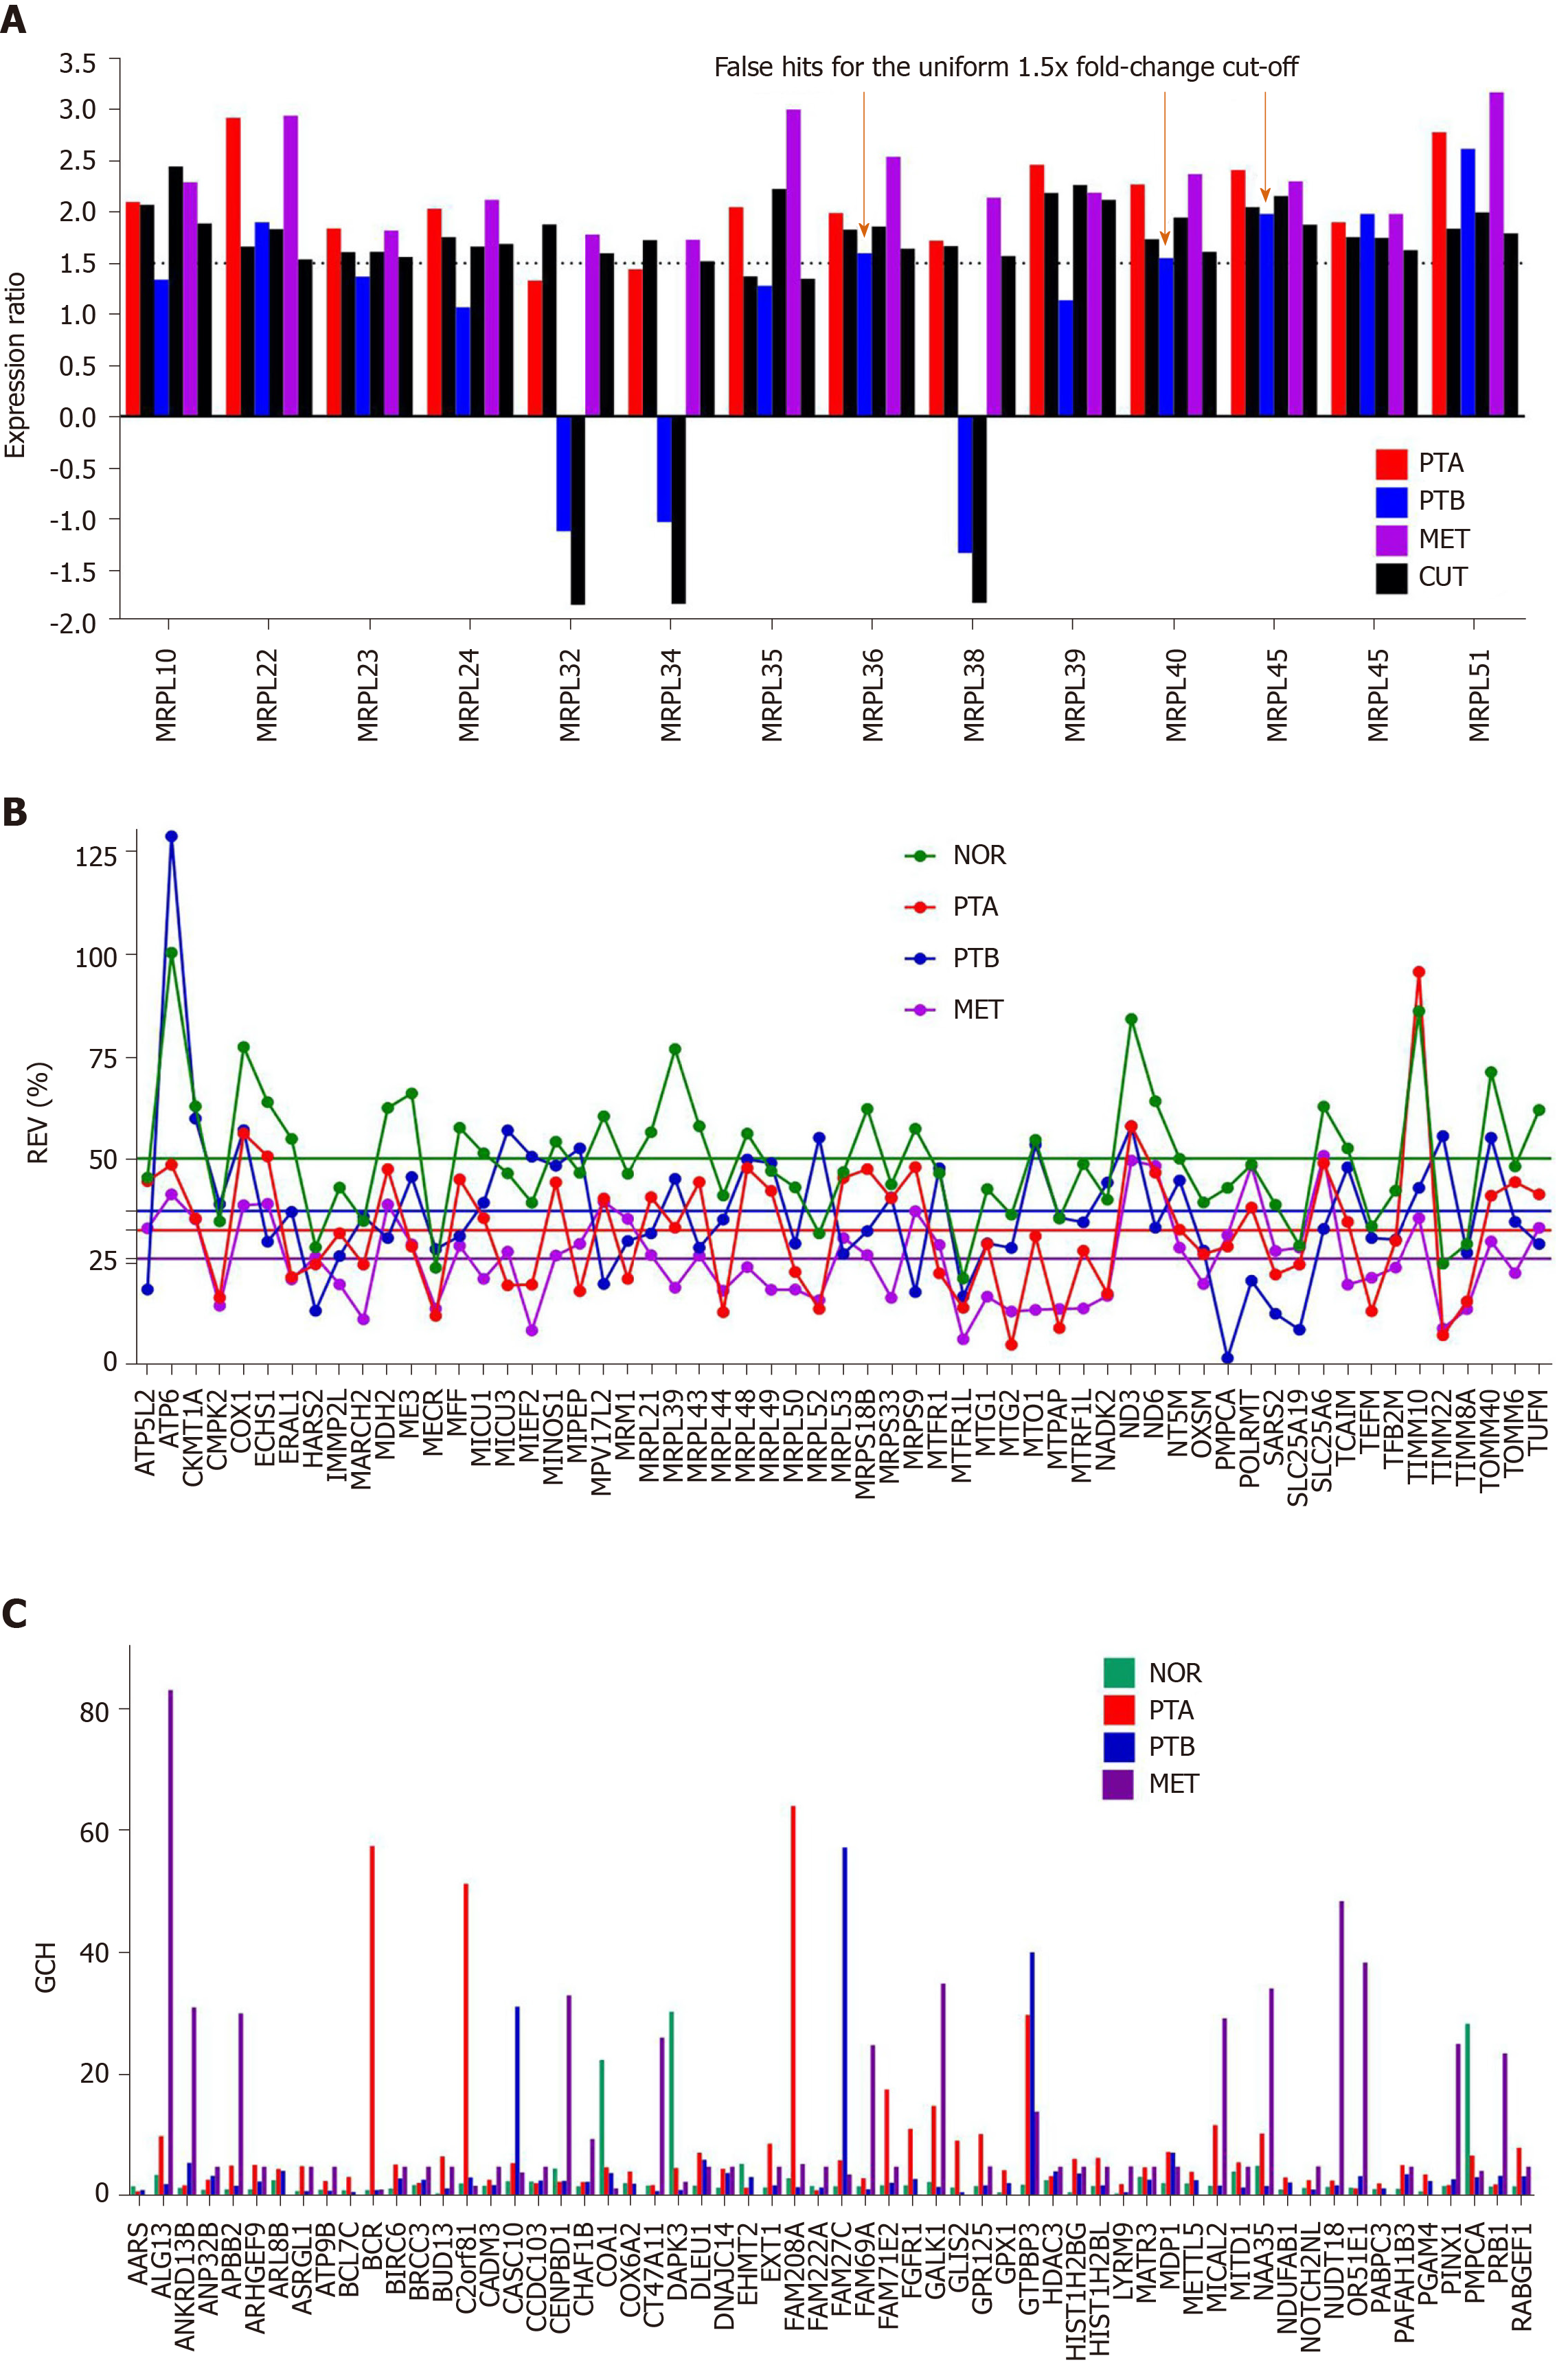
Figure 3 Comparing individual gene quantifiers in the four frozenly preserved specimens of a clear cell renal cell carcinoma 74 years old man.
A: Expression ratios (negative for down-regulation) of 14 MRPL genes in the three cancer samples (PTA, PTB, MET) with respect to the normal tissue (NOR) from the studied clear cell renal cell carcinoma case. The arrows indicate the genes which would be false hits in the standard uniform 1.5× absolute fold-change cut. Note that regulation is higher for most genes in MET than in PTA which at its turn is higher than in PTB; B: Relative expression variability (REV) of 59 randomly selected mitochondrial genes. Note the significantly lower averages for the cancer regions with respect to the control (healthy) tissue; C: GCH of the top 3 genes in each condition plus 48 randomly selected ones. NOR: Normal kidney tissue; PTA: Cancer nodule (primary tumor) A; PTB: Cancer nodule (primary tumor) B; MET: Metastatic chest wall. Colored continues lines are the average REVs in each condition. Note that the GCHs of the same gene are region dependent.
- Citation: Iacobas DA. Powerful quantifiers for cancer transcriptomics. World J Clin Oncol 2020; 11(9): 679-704
- URL: https://www.wjgnet.com/2218-4333/full/v11/i9/679.htm
- DOI: https://dx.doi.org/10.5306/wjco.v11.i9.679


